Scientific Results

Star formation in bars

As explained in “Hα study of a redshift-limited subsample“, one of the aspects of our project was to study the Hα emission of isolated spirals in its different aspects. Star formation depends strongly both on the local environment of galaxies, and on the internal dynamics of the interstellar medium. To disentangle the two effects, we obtained, in the framework of the AMIGA project, Hα and Gunn r photometric data for more than 200 spiral galaxies lying in very low-density regions of the local Universe. In one of our studies we caracterise Hα emission, tracing current star formation, of the 45 largest and less inclined galaxies observed for which we estimate the torques between the gas and the bulk of the optical matter. We could subsequently study the Hα morphological aspect of these isolated spiral galaxies. 

The imposed requirements have been:

Image analysis

In order to calculate the gravitational potential, density and torques in the plane of the disks of the galaxies, we processed the Hα and Gunn r corrected images as follows: the r band image (not scaled to Hα) and the Hα continuum subtracted image were used. The Gunn r images were used in order to estimate the gravitational potential of the galaxies.

To determine the bar/arm force at each radius, we made use of the method developed by García-Burillo et al. (1993, 2005) to compute the gravitational potential, applying it to our red images, supposing a constant stellar mass-to-light (M/L) ratio. A Fourier-component analysis of the potential was performed, using the m = 2 component to get the tangential forces (Block et al. 2002) and the m = 0 component to get the axisymmetric forces. Their quotient gives us a measurement of the bar/arm force.

We estimated the average torque depending on the radius: using the gravitational forces and the young stars born from the gas (Hα), we obtained the phase shift between gaseous arms and the potential well which creates the torques. Generally, due to the bar gravity torques, the gas flows into the centre (negative torque) from the corotation radius to the inner Linblad resonance (ILR) and flows outwards (positive torque) when outside the corotation radius, until the outer Lindblad resonance (OLR). This can be effectively observed for the galaxies in our sample. Finally, we estimated the angular momentum transfer and therefore the evolution time for bars in isolated galaxies.

Fig. 1

Fig. 2

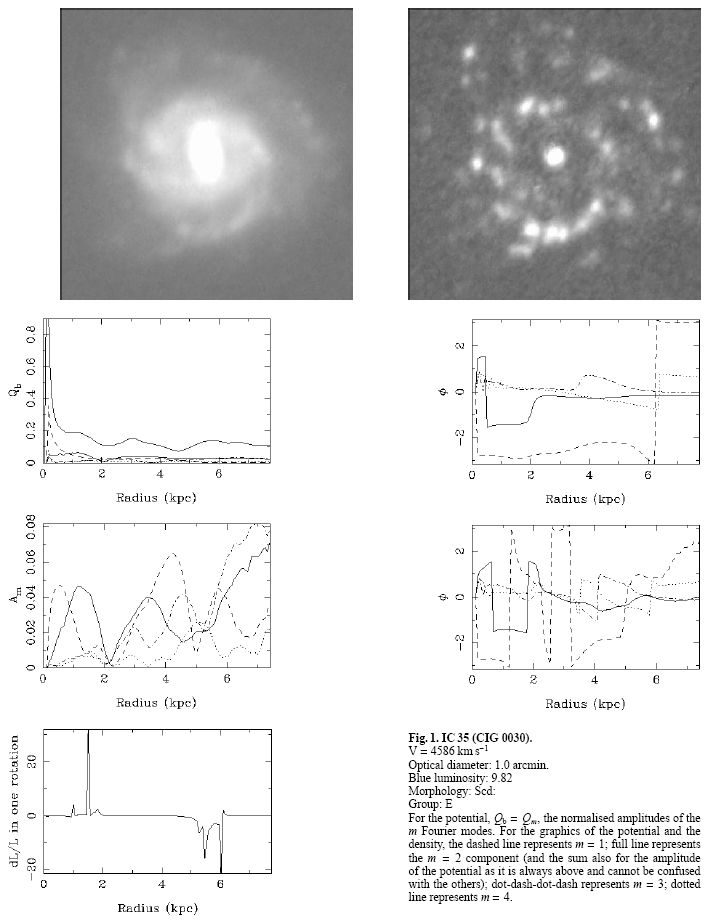
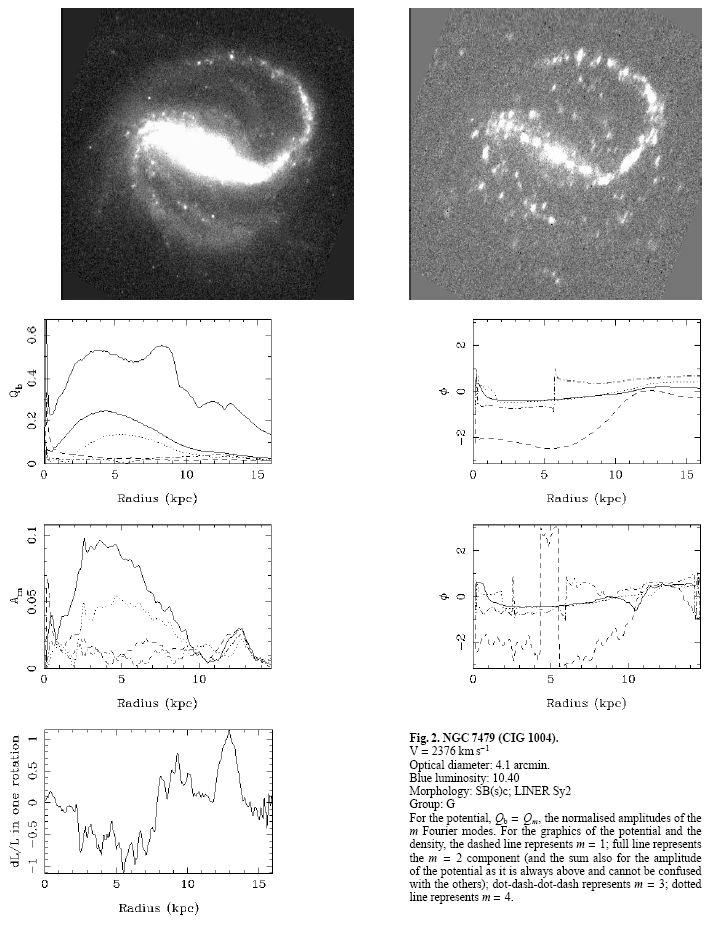
As an example, Figs. 1 & 2 display the images and graphics of the potential, density and torques corresponding to CIG 30 & CIG 1004, respectively. The first row shows the Gunn r broadband filter (left) and Hα narrow-band filter (right) deprojected images, from which the potential, density and torques have been estimated. The second row corresponds to the amplitude (left) and the phase (right) of the Fourier components of the potential. The third row corresponds to the amplitude (left) and phase (right) of the Fourier components of the density.

For the graphics of the potential and the density, the legend is the following: dashed line represents m = 1; full line represents the m = 2 component (and the sum also for the amplitude of the potential as it is always above and cannot be confused with the others); dot-dash-dot-dash represents m = 3; dotted line represents m = 4. The torques as a function of the radius of the galaxy is presented in the bottom left panel. The corotation occurs at the radius defined by the change of sign for dL/L. And dL/L shows that in one rotation, the gas loses a non negligible fraction of its angular momentum, which can bring constraints on the life time of the morphological patterns of the galaxy. The legend in the bottom right corner gathers the CIG number, the observed recession velocity (in km s−1), the optical diameter D25 (in ´), the blue luminosity, the morphological type and the group to which the galaxy belongs. The Gunn r and Hα images, along with the graphics of the potential, density and torques of the full sample of the 45 galaxies are available in PDF File Verley et al. 2007

Conclusions

We performed a detailed morphological study of this sample and compared it with numerical simulations, coming to the following results: