Strong far-infrared cooling lines, peculiar CO kinematics, and possible star-formation suppression in Hickson Compact Group 57

Scientific Results

Strong far-infrared cooling lines, peculiar CO kinematics, and possible star-formation suppression in Hickson Compact Group 57

In this work, [C II] and [O I] observations from Herschel and CO(1-0) maps from the Combined Array for Research in Millimeter Astronomy (CARMA) of the Hickson compact group HCG 57 are presented, focusing on the galaxies HCG 57a and HCG 57d.


HCG 57a has been previously shown to contain enhanced quantities of warm molecular hydrogen consistent with shock or turbulent heating. These observations show that HCG 57d has strong [C II] emission compared to L FIR and weak CO(1-0), while in HCG 57a, both the [C II] and CO(1-0) are strong. HCG 57a lies at the upper end of the normal distribution of the [C II]/CO and [C II]/FIR ratios, and its far-infrared (FIR) cooling supports a low-density, warm, diffuse gas that falls close to the boundary of acceptable models of a photon-dominated region. However, the power radiated in the [C II] and warm H2 emissions have similar magnitudes, as seen in other shock-dominated systems and predicted by recent models.


From these results, it seems that shock heating of the [C II] is a viable alternative to photoelectric heating in violently disturbed, diffuse gas. The existence of shocks is also consistent with the peculiar CO kinematics in the galaxy, indicating that highly noncircular motions are present. These kinematically disturbed CO regions also show evidence of suppressed star formation, falling a factor of 10-30 below normal galaxies on the Kennicutt-Schmidt relation. It suggests that the peculiar properties of both galaxies are consistent with a highly dissipative, off-center collisional encounter between HCG 57d and 57a, creating ring-like morphologies in both systems. Highly dissipative gas-on-gas collisions may be more common in dense groups because of the likelihood of repeated multiple encounters. The possibility of shock-induced star-formation suppression may explain why a subset of these HCG galaxies has been found previously to fall in the mid-infrared green valley.


Top: the Spitzer 3.6 μm−4.5 μm−8.0 μm true color image (left, corresponding to blue, green, and red, respectively) is overlaid with the integrated intensity contours (moment 0; white) of the Herschel [C ii] emission detected in HCG 57. The dotted line box represents an area that is 1.5″ on a side. A zoomed-in map is shown on the right that includes the mean velocity (moment 1) map of the [C ii] data from Herschel, overlaid with isovelocity contours (black) as well as the moment-0 contours (white). Bottom: the three-color g-r-i SDSS image (left) is overlaid with the CO(1–0) moment-0 map from CARMA (white contours). A zoomed-in map is shown on the right that includes the moment-1 map of the CO(1–0) overlaid with isovelocity contours as well as moment-0 contours. Major tick marks on both three-color images represent 1′ and 20” on each moment-1 map. The CO(1–0) and [C ii] velocity fields are consistent with one another, given the difference in spatial resolution between the two instruments and some contamination of the [C ii] velocity field of HCG 57a by 57d. The largest mixing of kinematic components occurs in the southeastern part of the disk where the channel maps show the largest overlap of emission between the two galaxies.


[C ii] channel maps from Herschel listed in heliocentric, optically defined velocities, with contour colors presented relative to the systemic velocity of HCG 57a overlaid on the Spitzer continuum-subtracted nonstellar 8.0 μm image. The [C ii] contour colors represent the red- and blue-shifted components seen. Contours begin at the ±3σ level and then are made in 3σ increments, with gray contours representing negative contours. In the first panel, we show a size scale (bottom left), and the 9.4″ Herschel PACS native spaxel is shown as a cross, overlaid with the chosen pixel size (3”) for the combined, projected [C ii] maps (bottom right). [C ii] is brightest in HCG 57d, but fainter emission is clearly present over a wide range of velocities in HCG 57A, especially near the nucleus. Velocity labels with channels closest to the systemic velocities of HCG 57a (of 8727 km s−1) and of HCG 57d (of 8977 km s−1) are displayed in yellow and cyan, respectively. The color of the contours consistently represents a velocity range between 8240 and 9330 km s−1.


g-r-iSDSS image shown with the individual CO(1–0) channel maps from CARMA, listed in heliocentric, optically defined velocities with contour colors relative to the systemic velocity of HCG 57a. The colors of the contours represent the red- and blue-shifted components seen. The black cross in each panel represents the nucleus of HCG 57a determined from the 2MASS imaging. Contours begin at the ±2.5σ level and then are made in 1σ increments, with gray contours representing negative contours. A size scale as well as the synthesized beam size of CARMA of 4.6 × 3.3 arcsec are shown in the first panel. Channels closest to the systemic velocities of HCG 57a (of 8727 km s−1) and of HCG 57d (of 8977 km s−1) are listed in yellow and cyan, respectively. The color of the contours consistently represents a velocity range between 8240 and 9330 km s−1.


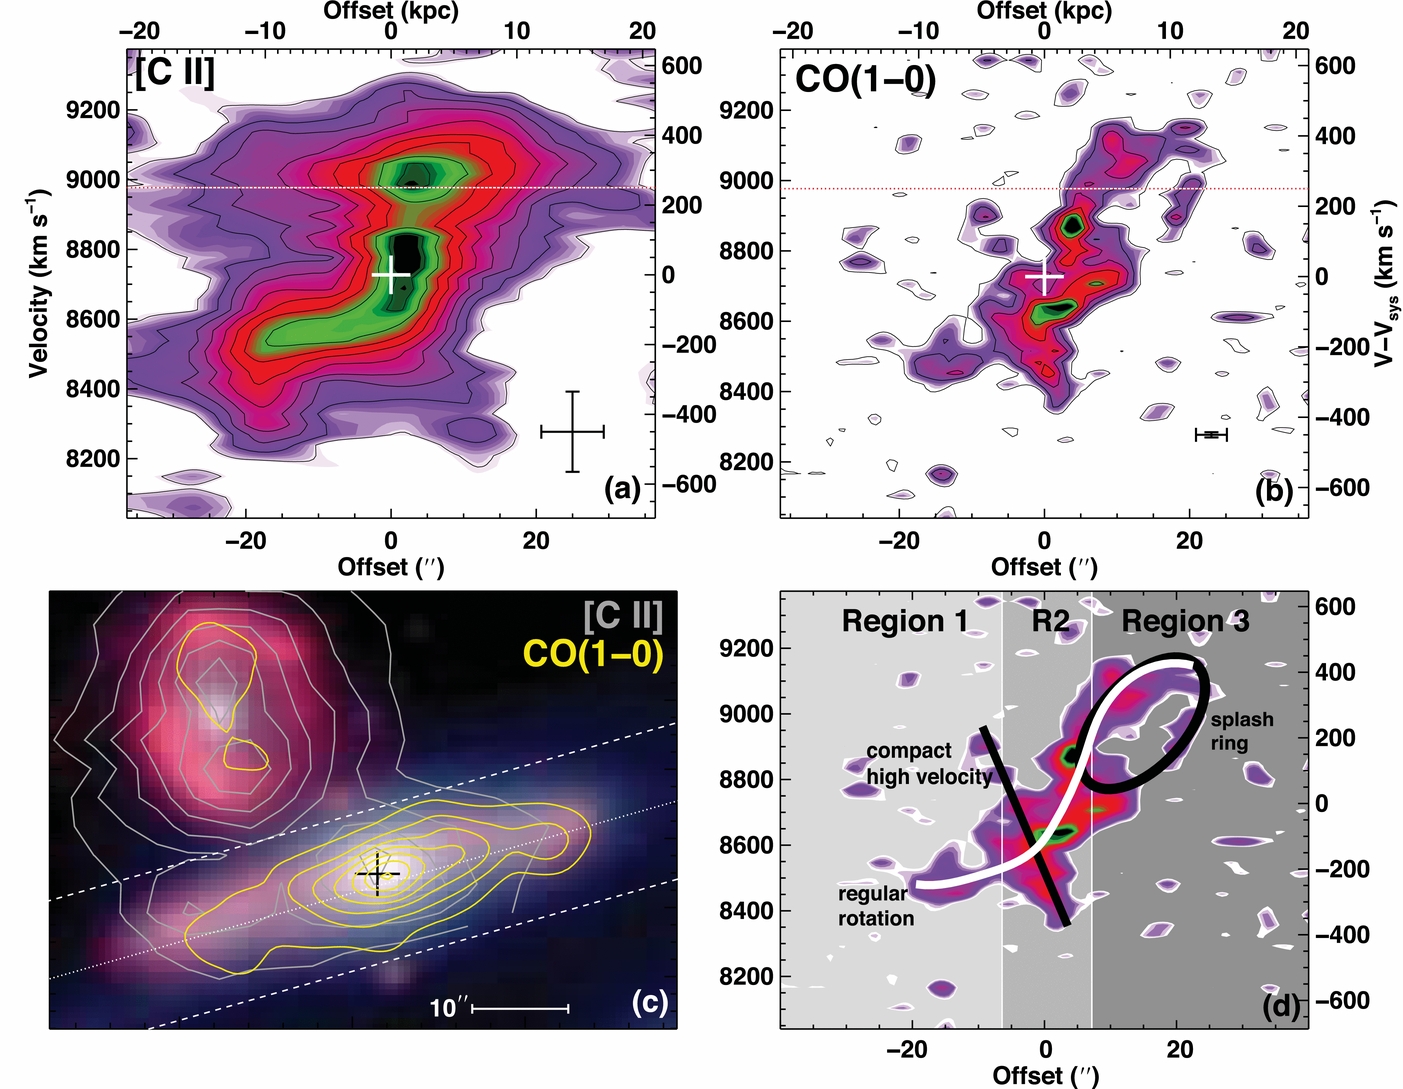
Top left: position–velocity diagram (PVD) in [C ii] of HCG 57a. Although it is clear that smoothing of both the pixels and the velocities is an issue, the PVD shows multiple components. There seems to be a [C ii] emission component originating at the systemic velocity of HCG 57d, but it is only offset by ≈5” from the HCG 57a nucleus. Top right: the CO(1–0) PVD, which has been derived from the same spatial box as the [C ii], though less extended. The red dotted horizontal line appears in both PVDs and represents the systemic velocity of HCG 57d. The white point represents the velocity and RAcenter of HCG 57a, as determined from a 2MASS Ks-band image. The black points show the uncertainties in each axis. The position of the minimum and maximum velocity offsets for the contours, which for CO(1–0) are −390 and 465 km s−1, and for [C ii] are −540 and +580 km s−1. Bottom left: the angle and the boundaries of the region summed (white dashed line), overlaid upon the three-color Spitzer IRAC three-color map and the [C ii] contours (gray) and CO(1–0) contours (yellow). Bottom right: the CO(1–0) PVD overlaid with a schematic representing the compact high-velocity component (black), the splash ring (black), and regular rotation (white).


PDF File Alatalo et al. 2014