Scientific Results

Infrared Diagnostics

We describe the mid- (MIR) and far- (FIR) infrared properties of AMIGA sample. For this aim, we reprocess IRAS MIR/FIR survey data using the ADDSCAN/SCANPI utility for 1030 out of 1050 galaxies from the Catalogue of Isolated Galaxies (CIG). We focus on diagnostics (FIR luminosity, R = log(LFIR/LB), and IRAS colours) thought to be sensitive to effects of environment or interaction.

Our sample shows a strong LFIR vs. LB correlation (see Fig. 1). Applying a linear regression fit and taking into account the upper limits, we derive a slope steeper than one (LFIR ∝ LB1.41). This correlation serves as a baseline from which deviations for other samples can be determined. We compared our regression fit to LFIR and LB from interacting samples and found that interacting galaxies showed an enhancement of the FIR emission (see Fig. 2).

Fig. 1 LFIR vs. LB for the optically complete, magnitude limited subsample (n = 701). The full line indicates the best-fit bisector slope derived with ASURV, the dotted line shows the result of the regression adopting LB, and the dashed line adopting LFIR (dashed) as independent variable.

Fig. 2 LFIR vs. LB for various interacting subsamples. The filled squares and arrows denote the galaxies from the CIG, showing signs of interaction. The dashed line is the regression fit to this subsample. The triangles indicate strongly interacting galaxies, and the crosses weakly interacting galaxies from Perea et al. (1997). The full line is the fit to the total AMIGA sample (n = 701) of Fig. 1.

The FIR luminosities for our sample were relatively low, with only few objects (2%) above log(LFIR/Lo)=10.5. We compared the distribution of the FIR luminosity and of R to that of the galaxy sample of the Center of Astrophysics (CfA, Huchra et al. 1983), whose FIR properties, based on data of the IRAS FSC, were studied in Thuan & Sauvage (1992) and Sauvage & Thuan (1992). The CfA sample consists of 2445 galaxies representing a complete flux-limited sample selected in Galactic coordinates. No selection with respect to environment was carried out. To properly compare the two data sets, we applied the same magnitude cutoff as in TS92 to our sample. Furthermore, to correctly compare the luminosity distributions, we derived the distances for the CfA sample in the same way as for our galaxies.distributions were different, with a probability between 97.22% (Logrank test) and 99.87% (Gehan’s Generalised Wilcoxon Test).

Fig. 3 The percentage FIR luminosity distribution for the FIR detections in the AMIGA sample restricted to (uncorrected) mzw ≤ 14.5 (shaded area) and the corresponding distribution for the CfA sample (dotted line).

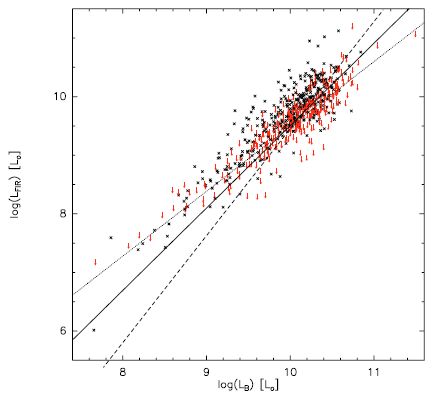
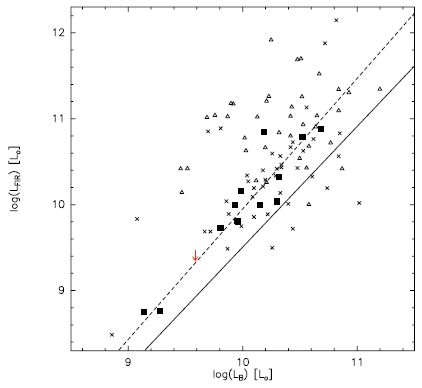
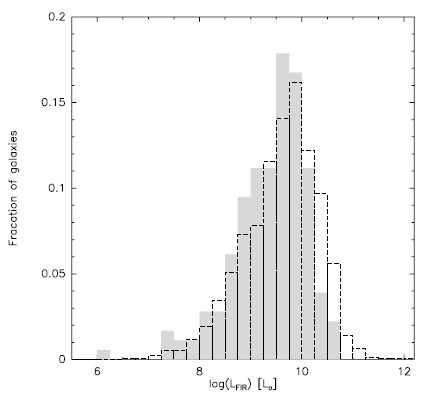
In Fig. 3 we show a comparison of our distribution of log(LFIR) to that of the CfA sample. Above log(LFIR/Lo) = 10.2, a clear excess of CfA galaxies in comparison to our sample is visible. The difference between the mean value of of the AMIGA and the CfA sample is 0.21-0.26 (with and without taking into account upper limits), which is a difference of 3-4 σ. We performed statistical two-sample tests in the package ASURV and found that the two distributions were different, with a probability between 97.22% (Logrank test) and 99.87% (Gehan’s Generalised Wilcoxon Test). The maximum probability increases to >99.95%, when only detections are taken into account. We also performed a Kolmogoroff-Smirnoff test on the detected data points and derived a probability of more than 99.75% that the mean values of are different. Therefore, there is strong statistical evidence that the AMIGA sample has a lower than the CfA sample, which is comparable, but not selected with respect to the environment. This suggests that the FIR luminosity is a variable driven by interaction. A similar result was found for the comparison of R = log(LFIR/LB), with the AMIGA sample a value 0.12-0.14 lower (with and without upper limits), which corresponds to 4-7 σ.


This study showed that as the largest and most isolated sample in the local Universe, AMIGA can serve as a valuable control when assessing the effects of environment on other local samples of galaxies. This can, in turn, clarify our interpretation of the FIR signature in samples at higher redshift.


PDF File Lisenfeld et al. 2007