Scientific Results

Optical colours of isolated galaxies

The optical colors of galaxies reflect their stellar populations and these colors correlate with morphology and environment. The  color-luminosity relation shows a strong bimodality with clear separation into red and blue sequences, corresponding roughly to early- (E, S0, and Sa) and late-type (Sb, Sc, and Irr) galaxies, as expected from the respective dominance of old and young stellar populations.


Here, we present a first look at SDSS (g-r) colors of isolated galaxies in the AMIGA sample. To check the effects of environment in the colors, we have compared the AMIGA colors with those obtained in other three samples: The nair & Abraham sample and the Efigi catalogue, without any selection of environment; and a catalogue of Pairs of galaxies.

Fig. 1 Distribution of the rest-frame (g-r) color as a function of Hubble type. The yellow points are the median values of each morphological type. The blue triangles are objects with asymmetries while the red open points represent objects suspected of being involved in interactions. The error bars represent the median absolute deviation.

In the figure above we show the distribution of AMIGA colors as a function of the morphological subtype. Not surprisingly, the reddest median values of (g-r) are found for the first four bins, which represent early-type galaxies, although median (g-r) values remain essentially constant out to T=3 (Sb). Beginning with type Sb we see a decrease in median (g-r) as expected if this sequence reflects a uniformly decreasing contribution from an old stellar population. We expected to find a lower color dispersion for spiral subtypes in the AMIGA sample because these galaxies are minimally affected by environmental effects, which apparently induce a higher color dispersion.

Fig 2 (g-r) color-magnitude diagram for the Sc (left) and the E/S0 (right) galaxies in the AMIGA sample. The blue diamonds are objects at z<0.02, the yellow triangles are galaxies at redshift 0.02<z<0.04, and=”” are=”” at=”” objects=”” pink=”” squares=”” the=”” z=””>0.04. The grey scale represents the density diagram obtained from the Nair & Abraham sample.</z<0.04,>

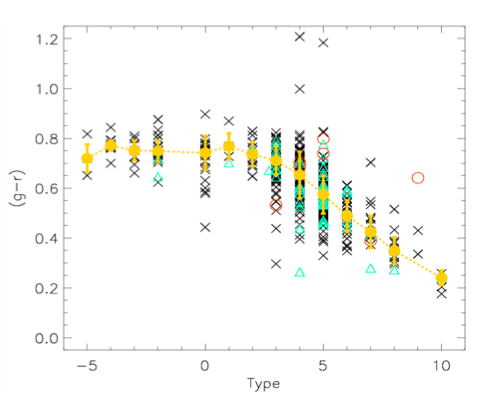
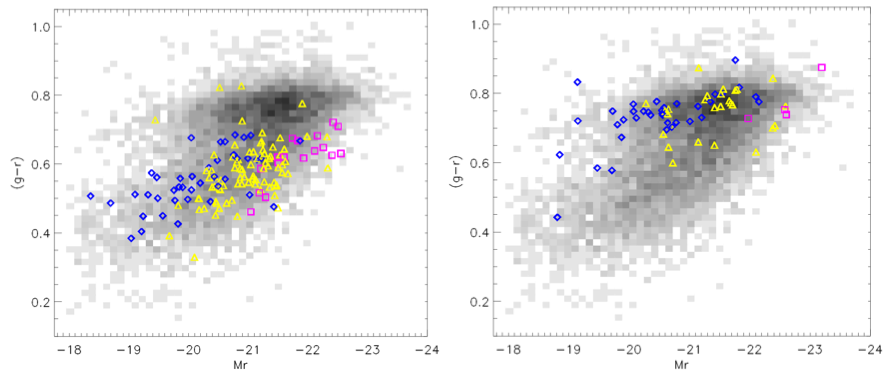
To study the source of this dispersion, we represented the color versus absolute magnitude in the r-band for Sc galaxies and early-types in the figure above. In grey scale, we have represented the sample of Nair & Abraham for all morphological types, so we can see the red and the blue sequences, that correspond to early and late type galaxies respectively. We found that our sample of Sc is distributed following the blue sequence, so the major source of color dispersion is the color-luminosity trend. But here, we identified a problem with the SDSS data because there is a bias of color versus redshift. This happens because the aperture used for the largest objects do not enclose the whole galaxy, so the contribution of the blue disk to the color is lower than it must be. We do not see this effect for early-types because they do not present this gradient of color.

We calculated median colors and absolute median deviations for all morphological types in the four samples. The sample of pairs was separated into wide and close pairs depending on the separation between the two galaxies. The median colors of early-types are similar for all samples and the largest differences of colors for spirals are found with respect to close pairs, than tend to be bluer than isolated galaxies but within the errors. However, the absolute median deviations are greater for both wide and close pairs with respect to the AMIGA sample. We found that the color distributions of morphological subtypes in AMIGA can be well described as Gaussian distributions with FWHM (g-r)=0.1-0.2. This is expected for samples where effects of environmental nurture have been minimized, and is supported by the fact that this Gaussianity was not observed in the sample of galaxy pairs.This redder color of AMIGA spirals and lower color dispersion compared with close pairs is likely due to a more passive star formation in very isolated galaxies.

PDF File Fernández Lorenzo et al. 2012