Instituto de Astrofísica de Andalucía
In  Verley et al. 20007a we performed a careful reevaluation of the degree of isolation of the CIG. The presence of candidate neighbours, in a different number and with different sizes and magnitudes in the environments of CIG galaxies, leads us to go a step further. We have quantified the degree of isolation of CIG galaxies according to different and complementary parameters, that produce a well characterised picture of their environment.
During the past forty years it has become clear that galaxy structural properties and evolution can be driven as much by environment as by initial conditions, even if the details of environmental influence are not yet well quantified.
Isolated galaxies are located in environments of such low density that they are unlikely to have been appreciably affected by nearest neighbours during at least a crossing time tcc = 3 Gyr ( Verdes-Montenegro et al. 2005). The observed physical properties of these systems are expected to be primarily determined by initial conditions and subsequent secular evolutionary processes.
We used the SDSS-DR9 photometric and spectroscopic databases to re-evaluate the degree of isolation of 636 galaxies in the Catalogue of Isolated Galaxies (CIG; Karachentseva 1973). This re-evaluation using CCD images and spectra continues and improves upon the work of Verley et al. ( 2007a, b) which was based upon the digitised photographic plates from Palomar Sky Survey (POSS-1 and POSS-2).
We developed an automatic method to search for neighbours near to each primary galaxy in order to revise the CIG isolation criteria introduced by Karachentseva (1973). We used the SDSS-DR9 to search for neighbours within a projected physical radius of 1 Mpc, which doubles the radius used in previous AMIGA studies. We first applied the CIG isolation criteria within 1 Mpc to the SDSS photometric database. Using the SDSS spectroscopic database, we then refined the study for 411 fields where 80% of the extended neighbours down to mr < 17.7 mag lying within a projected separation of 1 Mpc from the CIG galaxy have a measured redshift.
Of the 636 CIG galaxies considered in the photometric study, 426 galaxies appear to be isolated in projection: 86 CIG galaxies were found to be isolated according to the CIG isolation criteria within a projected field radius of 1 Mpc; 340 appear to be mildly affected by their environment. The use of the SDSS database permits one to identify faint companions that were not found in previous AMIGA studies ( Verley et al. 2007a). The SDSS provides linear photometry, improved sensitivity, and better spatial resolution than digitised photographic plates. Consequently, the isolation parameters of the revised AMIGA sample are improved, and reduce the sample by about 20%.
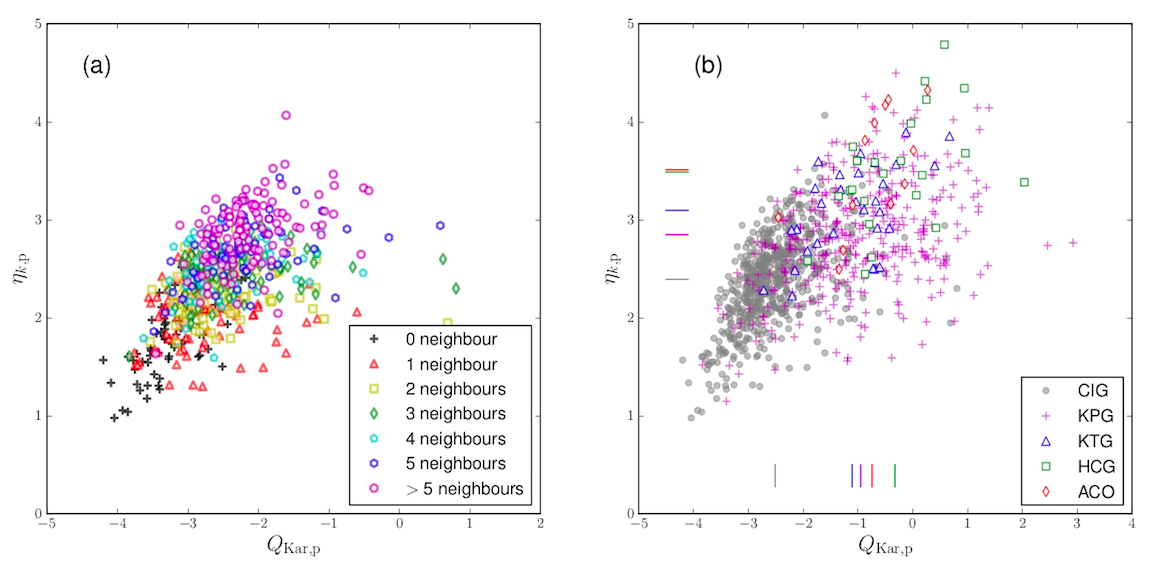
The isolation degree was quantified using two different and complementary parameters: the local number density ηk and the tidal strength Q, which affect the central CIG galaxy ( Verley et al. 2007b, Sabater et al. 2013). These two parameters are complementary in quantifying the isolation degree and give consistent results. The result of the quantification of the isolation degree using photometric data is shown in Fig. 1.
On average, galaxies in the AMIGA sample show lower values in local number density and tidal strength parameters than galaxies in denser environments such as pairs, triplets, compact groups, and clusters. In general, galaxies in the studied samples show higher values of the isolation parameters than those reported by Verley et al. (2007b).