 Instituto de Astrofísica de Andalucía
Distribution of faint atomic gas in Hickson Compact Groups using GBT data (2015)
Scientific Results
- Positions for CIG galaxies
- Redshift and distances
- Morphologies
- Isolation
- A catalogue of neighbours around isolated galaxies based on POSS I & II images
- Quantification of isolation based on POSS I & II images
- Revision of isolation criteria using the SDSS
- Effects of the environment on galaxies in the..
- Catalogues of isolated galaxies, isolated pairs, and isolated triplets..
- Star formation
- Optical specialization
- Radio continuum properties
- Atomic gas
- Isolated Galaxies
- Environment and faint features of CIG 96: deep optical and HI observations (2018)
- Atomic gas scaling relations (2018)
- A ∼12 kpc HI extension and other HI asymmetries in the isolated galaxy CIG 340 (2014)
- HI asymmetry in the isolated galaxy CIG 85 (2012)
- HI asymmetries in the isolated galaxy CIG 292 (2011)
- Asymmetries in isolated galaxies (2011)
- The large asymmetric HI envelope of CIG 96 (2005)
- Compact groups
- Studies of complementary samples
- Isolated Galaxies
- Molecular gas
- Nuclear activity
Distribution of faint atomic gas in Hickson Compact Groups using GBT data
In this work, 21 cm H I observations of four Hickson Compact Groups (HCGs) with evidence for a substantial intragroup medium using the Robert C. Byrd Green Bank Telescope (GBT) are presented. By mapping H I emission in a region of 25′ × 25′ (140–650 kpc) surrounding each of these 4 HCGs with the GBT, these observations provide better estimates of H I masses. This work has identified whether the diffuse gas has the same spatial distribution as the high surface brightness (HSB) HI features detected in the VLA maps of these groups by comparing the HI strengths between the observed and modeled masses based on VLA maps.
It was detected 65% more H I than that detected in the Karl G. Jansky Very Large Array (VLA) imaging of HCG 92. The HI observed with the GBT was found to have a similar spatial distribution to the HSB structures in HCG 31 and HCG 68.
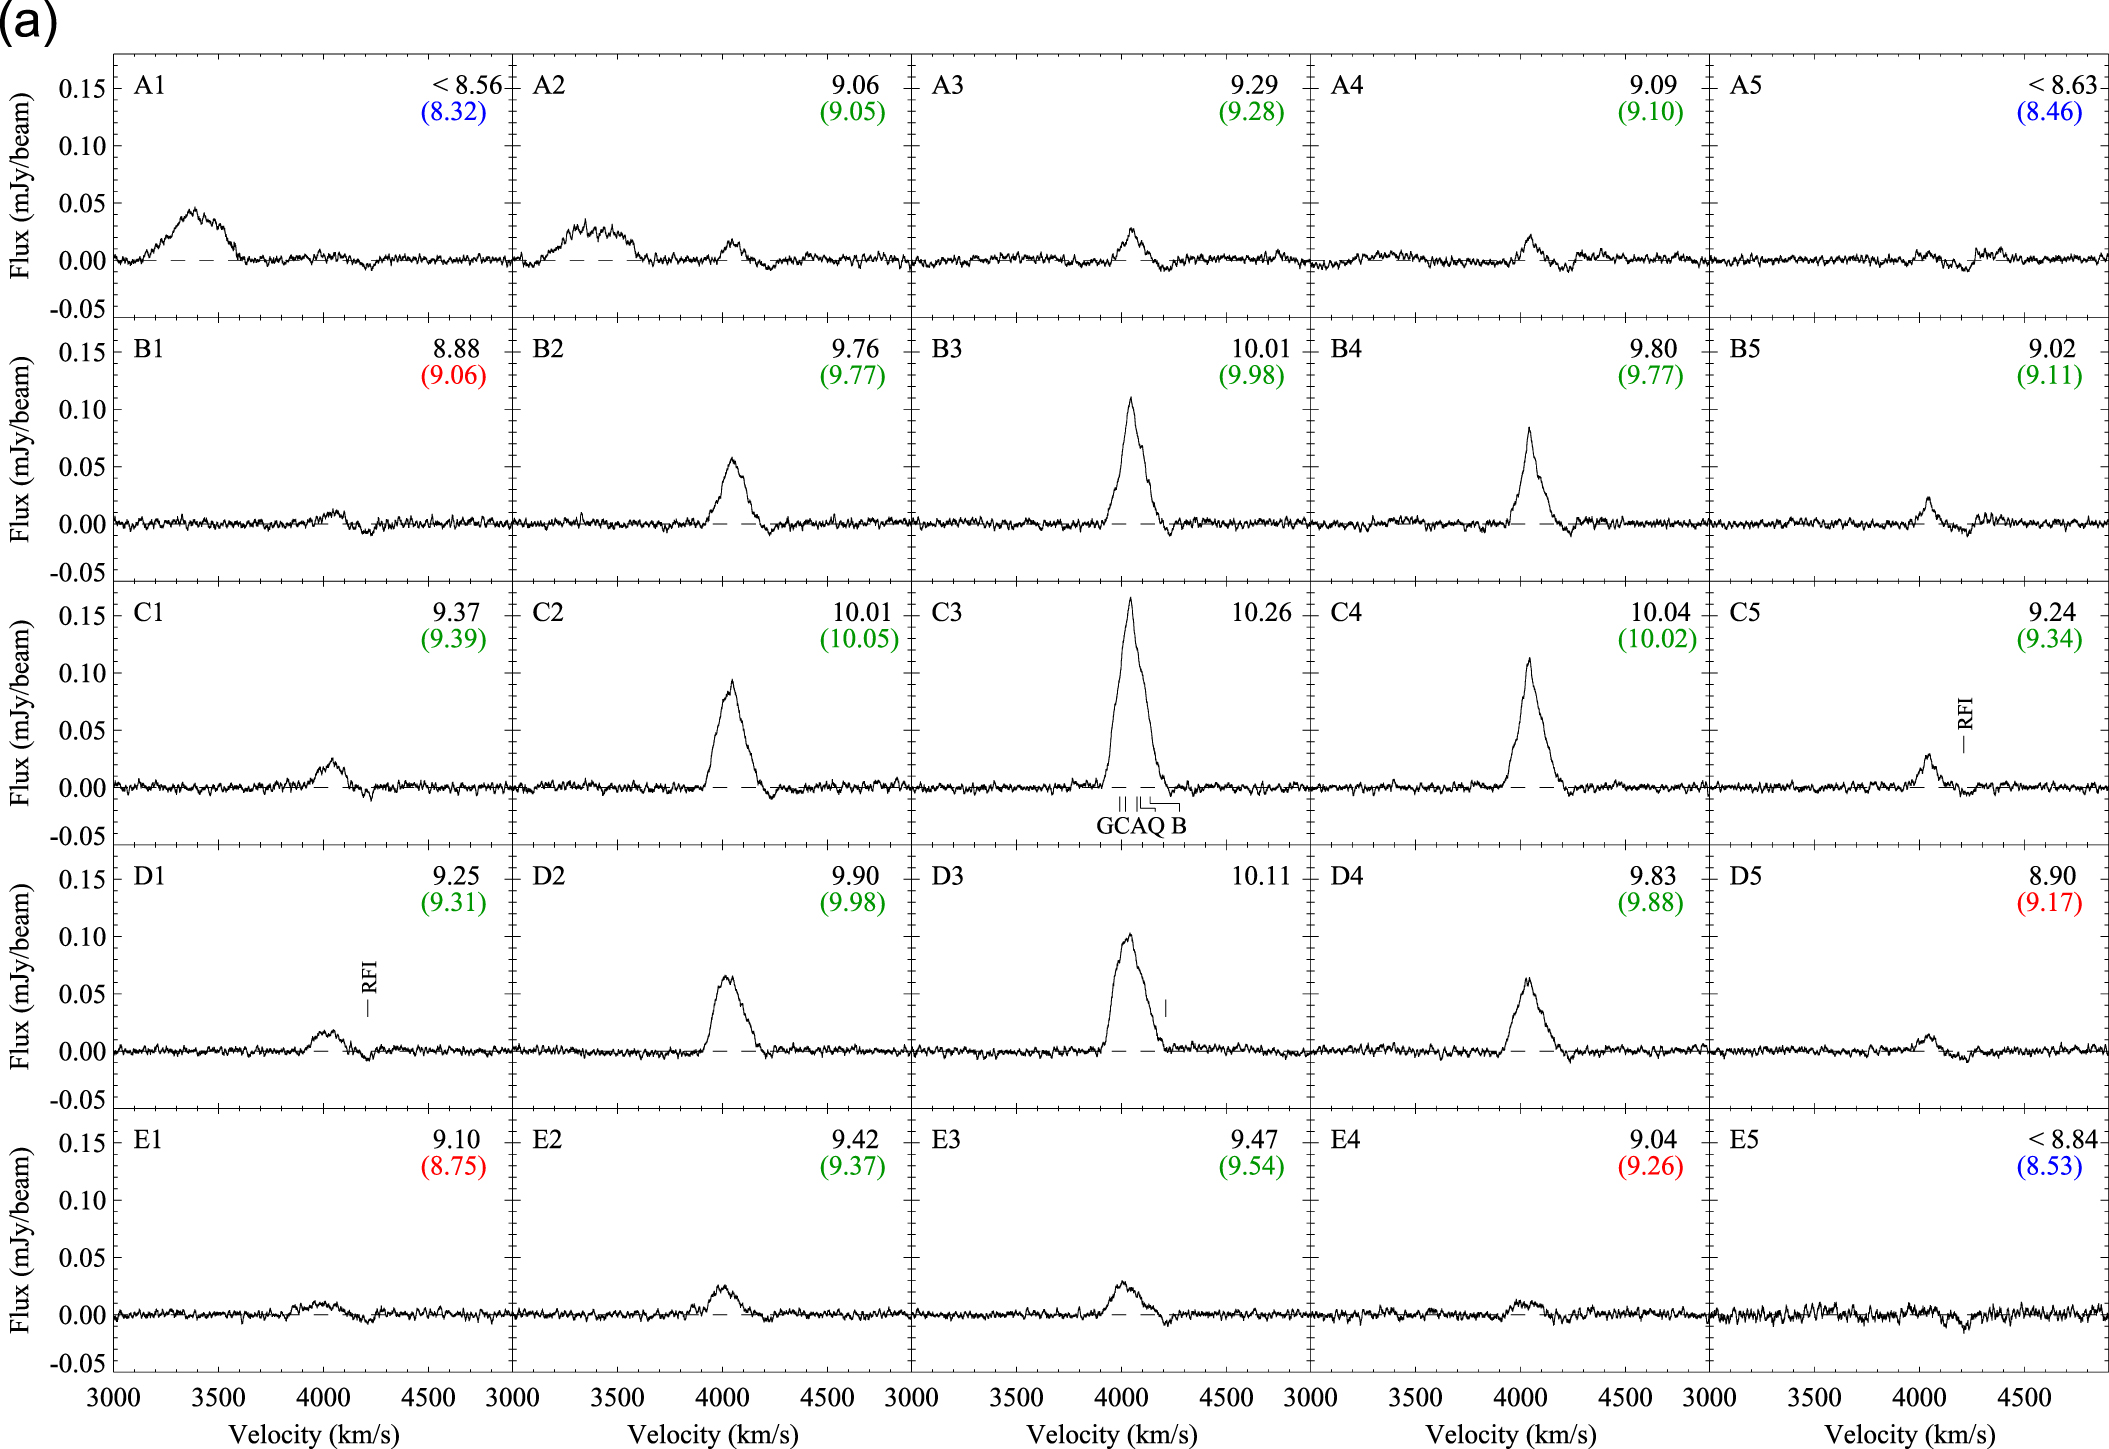
GBT 21 cm H I spectra for HCG31. The spectra have been plotted in a grid format similar to the 5 × 5 pointing scheme on the sky. Pointings are separated by 4′ from their neighbors, resulting in a total coverage of 25′ × 25′. The center of the map coincides with the center of the group. The data have been smoothed to 10 km s−1. The positions of the pointings are marked at the top left corner and their observed H I masses at the top right corner. We have listed the 5σ H I masses for spectra where no H I was detected. The modeled H I masses are shown in color. They are color-coded to show the agreement/disagreement between the observed and modeled masses in green/red. Pointings where the limiting H I masses are consistent with the predicted masses are shown in blue. The systemic velocities of the member galaxies are marked. The depression centered at 4200 km s−1 is an artifact left over after clearing RFI at that frequency. The group size as defined by Hickson (1982) and redefined by Verdes-Montenegro et al. (2005) places the entire group well within the central pointing. The redshifts of the member galaxies place all of them within the velocity coverage of the H I profile. At the redshift of the group, each pointing is separated by 66 kpc. The broad feature between 3170 and 3600 km s−1 has no associated optical galaxy. It may be an RFI feature although not clear from the current observations. Further observations are required to confirm it.
Conversely, the observed HI distributions in HCG 44 and HCG 92 were extended and showed significant offsets from the modeled masses. Most of the faint gas in HCG 44 lies to the northeast–southwest region and in HCG 92 lies in the northwest region of their respective groups.
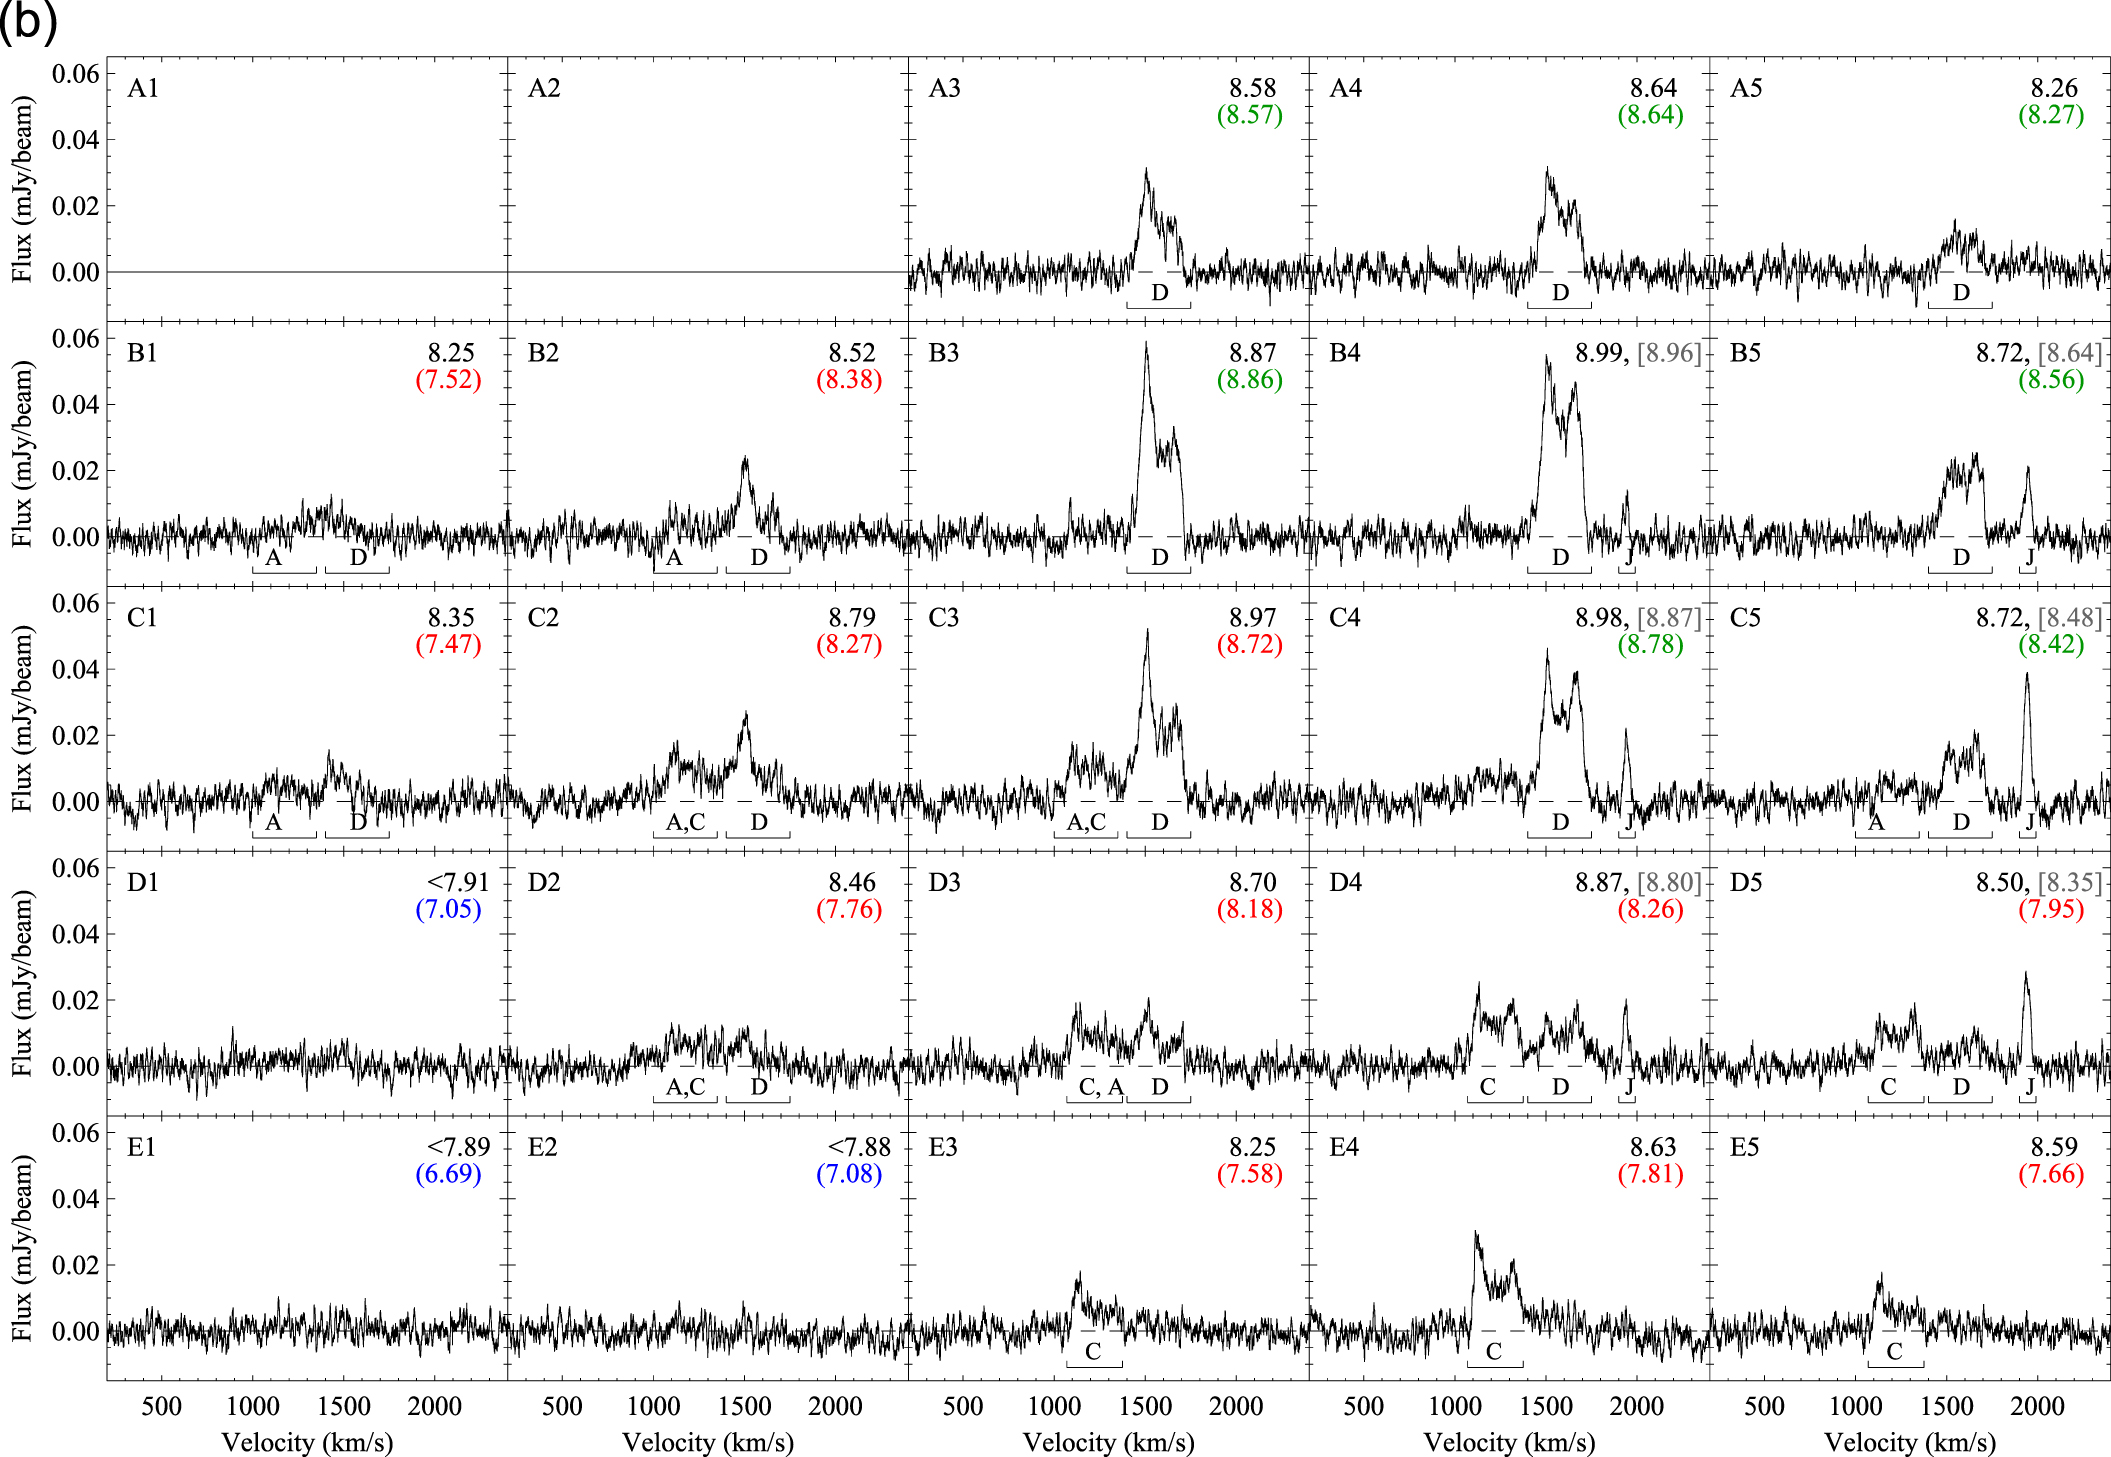
Spectra from 23 pointings around HCG 44. Pointings are separated by 4′ or 23 kpc at the redshift of the group. We were unable to obtain spectra for two of the pointings owing to time constraints during observations. Features associated with the individual galaxies are identified and are marked A, C, D, or J, corresponding to 44A, 44C, 44D, and SDSS J1012. Check details about the reduction, etc. in the previous figure.
The spatial and dynamical similarities between the total (faint+HSB) and the HSB H I indicate that the faint gas is of tidal origin. It was found that the gas will survive ionization by the cosmic UV background and the escaping ionizing photons from the star-forming regions and stay primarily neutral for at least 500 Myr.
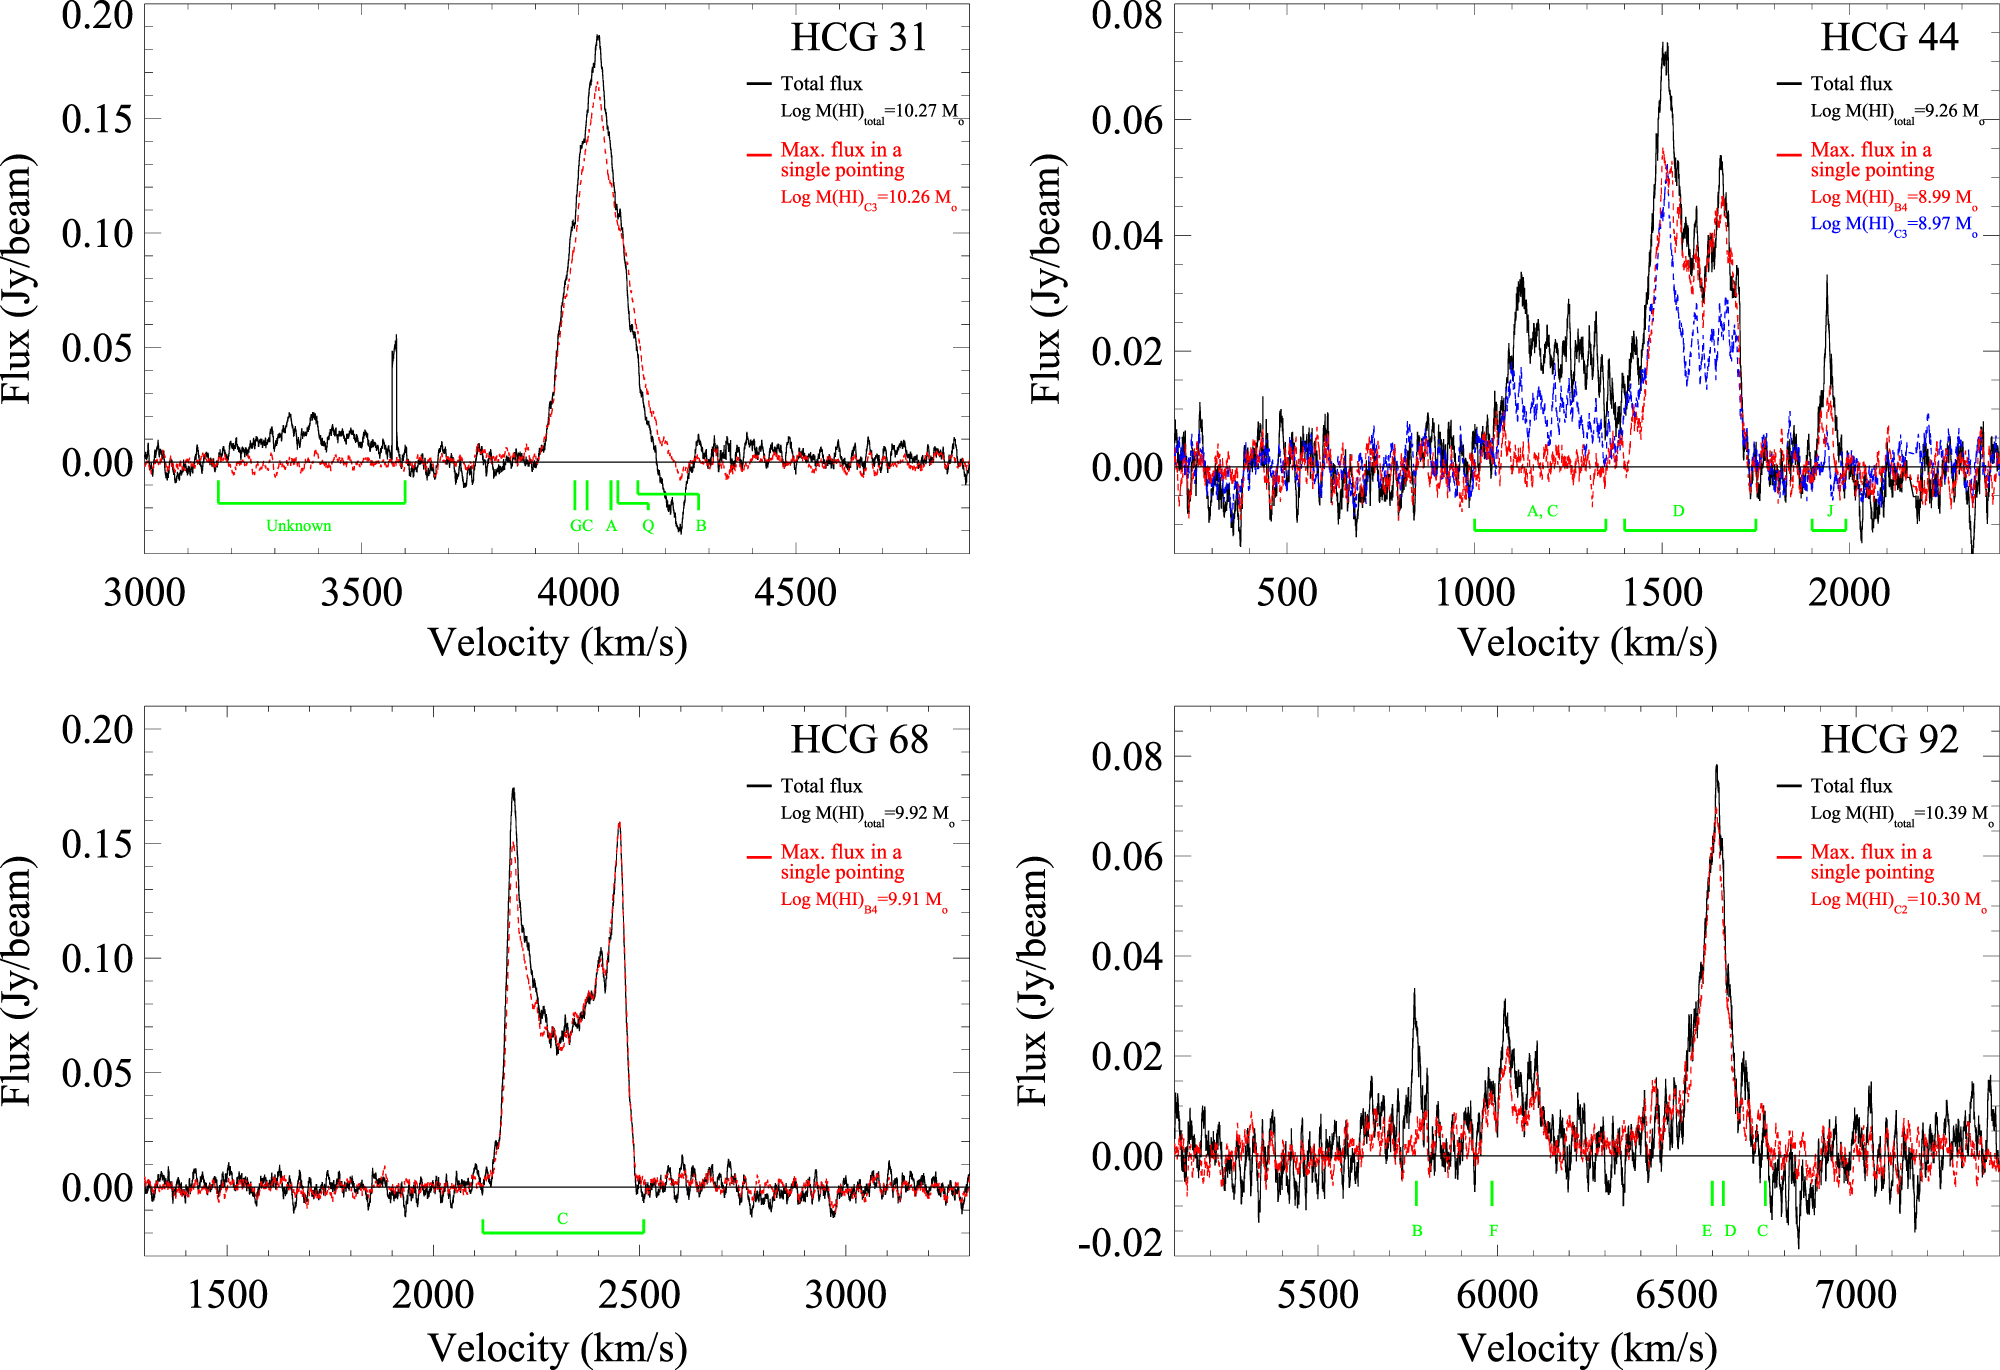
Integrated H I spectra of all the pointings around the four groups are shown in black. For comparison the spectrum is shown from the pointing with most H I flux in red. For HCG 44, the spectrum from the central pointing is shown in blue and is of similar strength to the pointing of maximum flux. The labels in the top right corner specify the group, its total H I mass, and the H I mass associated with the pointing containing the most flux. The peak flux is 98% of the total flux observed in HCG 31 and HCG 68. This implies that most of the gas is in the central region, and gas in the outskirts is just 2% of the total H I in these groups. In HCG 92 the gas is more spread out and the peak is 81% of the total H I, whereas in HCG 44 the peak flux is just 54% of the total flux. The broad feature in the spectra of HCG 31 between 3170 and 3600 km s−1 is not associated with any optical galaxy in the SDSS images and is certainly not asscociated with the group. Hence, that feature was left out of the mass estimate given in the top right corner.
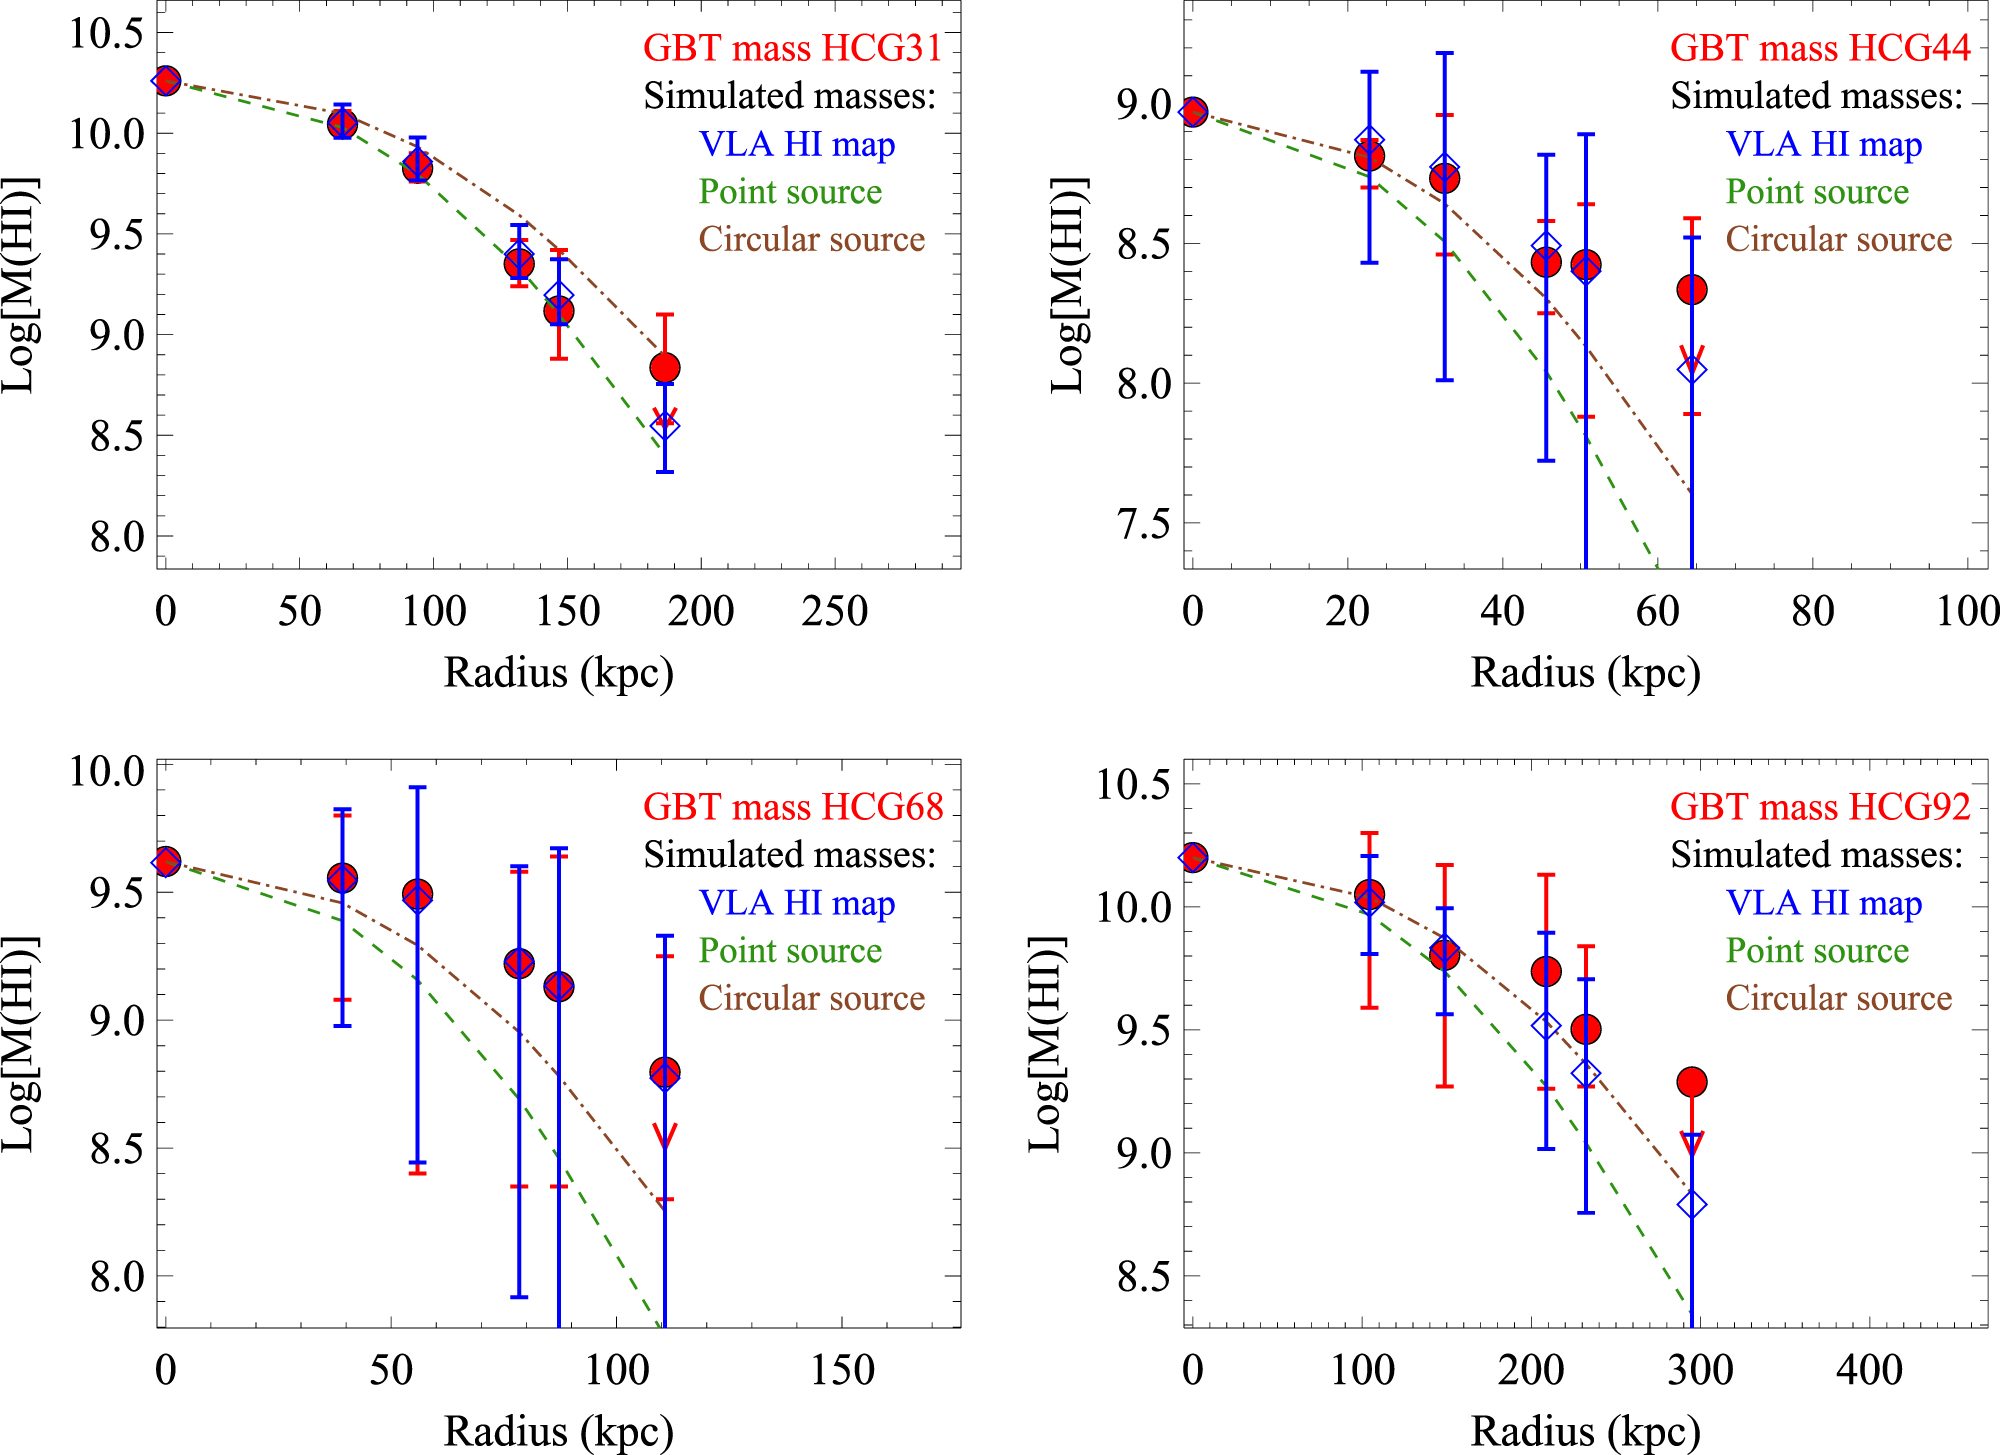
Radial distributions of H I in the four groups. The solid red circles represent the observed H I mass, and the blue open diamonds represent the modeled masses. The ranges in the observed and modeled masses are shown as vertical bars. Each of these values was obtained by averaging 4–8 pointings that are equidistant from the center of the map. The exception to this is the value at zero, which represents the central pointing. Models for a point source and a circular source are overplotted in green and brown, respectively. It is worth noting that not all the pointings that were averaged are independent, although the modeled masses take that into account. The model data were normalized at the central pointing (C3) corresponding to zero in the absissa. The data from HCG 31 match those of a point source, whereas the other sources are slightly resolved. The range of values in the observed and the modeled data match well for HCG 31 and HCG 68, whereas HCG 44 and HCG 92 show large differences in the spread.
References:
Hickson P. 1982 ApJ 255 382
Verdes-Montenegro L., Yun M. S., Williams B. A. Et al 2001 A&A 377 812
 Borthakur et al. 2015