 Instituto de Astrofísica de Andalucía
HI asymmetries in the isolated galaxy CIG 292 (2011)
Scientific Results
- Positions for CIG galaxies
- Redshift and distances
- Morphologies
- Isolation
- A catalogue of neighbours around isolated galaxies based on POSS I & II images
- Quantification of isolation based on POSS I & II images
- Revision of isolation criteria using the SDSS
- Effects of the environment on galaxies in the..
- Catalogues of isolated galaxies, isolated pairs, and isolated triplets..
- Star formation
- Optical specialization
- Radio continuum properties
- Atomic gas
- Isolated Galaxies
- Environment and faint features of CIG 96: deep optical and HI observations (2018)
- Atomic gas scaling relations (2018)
- A ∼12 kpc HI extension and other HI asymmetries in the isolated galaxy CIG 340 (2014)
- HI asymmetry in the isolated galaxy CIG 85 (2012)
- HI asymmetries in the isolated galaxy CIG 292 (2011)
- Asymmetries in isolated galaxies (2011)
- The large asymmetric HI envelope of CIG 96 (2005)
- Compact groups
- Studies of complementary samples
- Isolated Galaxies
- Molecular gas
- Nuclear activity
HI asymmetries in the isolated galaxy CIG 292
We present Expanded Very Large Array (EVLA) D-array observations of the neutral hydrogen of CIG 292, an isolated SA(s)b galaxy at a distance of ∼24.3 Mpc. From previous HI single dish observations the galaxy was known to have a mildly asymmetric HI profile (Aflux = 1.23 ± 0.3).

Left panel: integrated HI spectrum of CIG 292 derived from the EVLA data (solid line). Emission is detected in the velocity range 1650 km s−1 to 1950 km s−1 . The dashed dotted line represents the 43 m Green Bank single dish HI profile retrieved from Springob et al. (2005). Right panel: integrated EVLA HI spectrum of CIG 292 where the approaching portion of the spectrum has been flipped around V = 1818 km s−1 (vertical line) and overplotted (dash-dotted line) for comparison with the receding portion of the spectrum. The lower panels show the difference between each pair of spectra.
Our EVLA observations show there is ∼12% more HI projected south of the optical center (approaching velocities) than in the north (receding velocities), despite the HI extending ∼16% further to the north than the south. The HI projected within the optical disk must have been perturbed within the HI relaxation time (∼108 yr) which implies that this cannot have been caused by any of the three nearest companions, as their distance (∼0.5 Mpc) is too large. Neither HI-rich companions nor tidal tails were found within our field of view and velocity range covered. Our kinematical data suggest that the inner part harbors an oval distortion whereas the outer regions show signs of a modest warp.
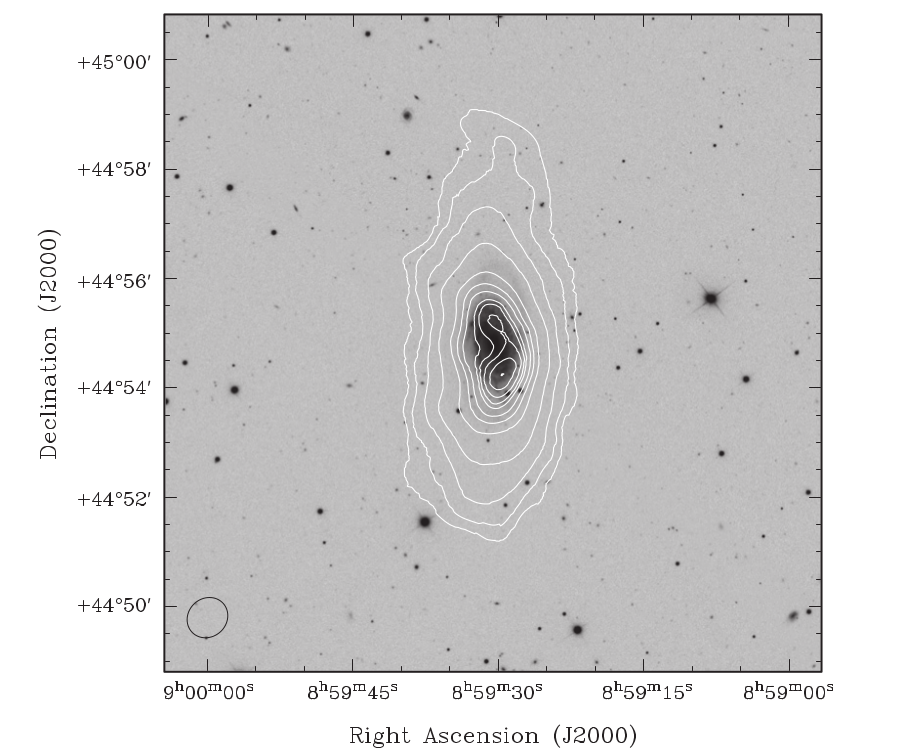
HI contours of CIG 292 on an SDSS r-band image. Contours are drawn at 0.5, 1.0, 1.2, 3.7, 6.2, 7.6, 8.5, 9.5, 10.0, 10.6, 11.4, and 12.1 × 10²⁰ at cm−2 . The beam size is shown in the bottom left corner of the image.
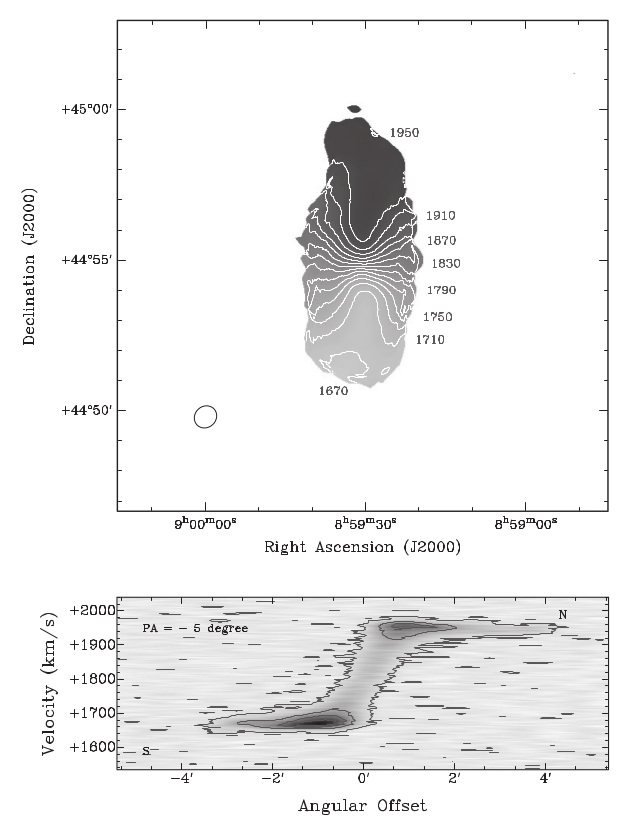
Top panel: velocity field of CIG 292 with velocity contours superimposed. Velocity contours range from 1670 km s−1 (southern half) to 1950 km s−1 (northern half) in steps of 20 km s−1 . We only label every other contour. Bottom panel: position–velocity diagram along the major axis taken at a P.A. of −5º. Contours are at a level of 0.25, 0.4, 1.4, 2.4, 3.4, and 4.4 mJy beam−1.
The mild asymmetry in the HI global profile thus actually masks stronger asymmetries in the two-dimensional distributions of gas and star-forming regions in this galaxy. Since the galaxy is isolated, this must predominantly be due to processes related to its formation and secular evolution.