 Instituto de Astrofísica de Andalucía
Scientific Results
- Positions for CIG galaxies
- Redshift and distances
- Morphologies
- Isolation
- A catalogue of neighbours around isolated galaxies based on POSS I & II images
- Quantification of isolation based on POSS I & II images
- Revision of isolation criteria using the SDSS
- Effects of the environment on galaxies in the..
- Catalogues of isolated galaxies, isolated pairs, and isolated triplets..
- Star formation
- Optical specialization
- Radio continuum properties
- Atomic gas
- Isolated Galaxies
- Environment and faint features of CIG 96: deep optical and HI observations (2018)
- Atomic gas scaling relations (2018)
- A ∼12 kpc HI extension and other HI asymmetries in the isolated galaxy CIG 340 (2014)
- HI asymmetry in the isolated galaxy CIG 85 (2012)
- HI asymmetries in the isolated galaxy CIG 292 (2011)
- Asymmetries in isolated galaxies (2011)
- The large asymmetric HI envelope of CIG 96 (2005)
- Compact groups
- Studies of complementary samples
- Isolated Galaxies
- Molecular gas
- Nuclear activity
CO molecular gas content
We have CO(1-0) data for 273 AMIGA galaxies, most of them (n=186) from our own observations with the IRAM 30m and the FCRAO 14m telescopes, and the rest from the literature.
We constructed a redshift-limited sample containing galaxies with 1500 km/s < v < 5000 km/s and excluded objects with morphological evidence of possible interaction. This sample (n = 173) is the basis for our statistical analysis. It is dominated, both in absolute number and in detection rate, by spiral galaxies of type T = 3–5 (Sb-Sc). Most galaxies were observed with a single pointing towards their centers. Therefore, we performed an extrapolation to the total molecular gas mass expected in the entire disk based on the assumption of an exponential distribution. We then studied the relationships between the molecular gas mass and other galactic properties (blue luminosity, luminosity in the K-band as a tracer of the stellar mass, optical diameter, and far-infrared (FIR) luminosity).
We find good correlations between the molecular gas mass and the blue luminosity, k-band luminosity and FIR luminosity (as shown in the figures below). The correlation with the blue and the k-band luminosity can be used to predict the expected molecular gas in an isolated galaxies and search for an excess or deficiency for galaxies in other environments.
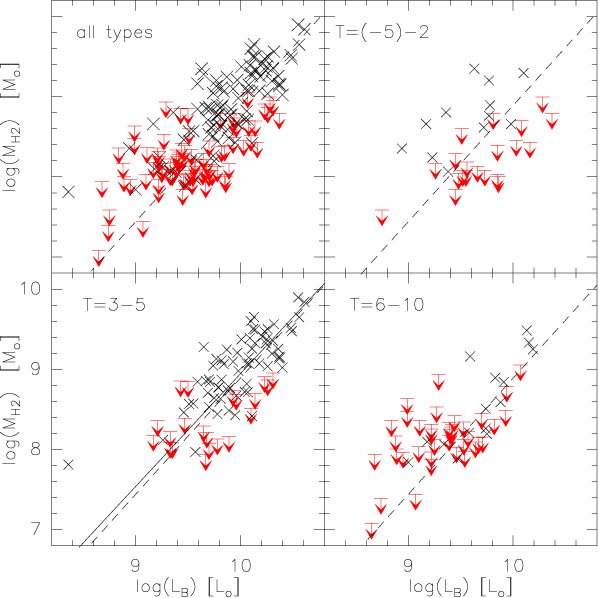
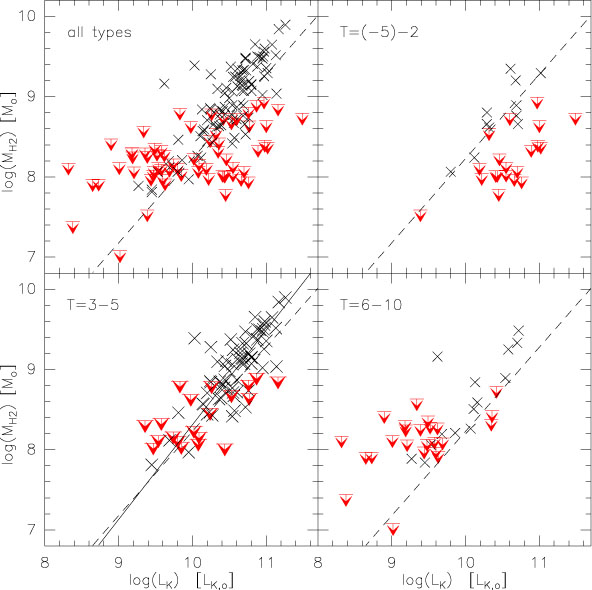
Fig. 1 The molecular gas mass vs. the blue luminosity (left), respectively the k-band luminosity (right) for the redshift-limited CO sample (n = 173), including all morphological types, and for groups of different morphological types. The dashed line gives the best fit bisector (derived with ASURV) for all morphological types and the solid line is the best fit for the T = 3 − 5 sample.
We used these relations to search for deviations of the molecular gas mass in samples of interacting galaxies from the literature. We found an enhancement of the molecular gas content in the samples of strongly interacting galaxies from Casasola et al. (2004, A&A, 422, 941) and Perea et al. (1997, ApJ, 490, 166) but none in the sample of weakly interacting galaxies from Perea et al.
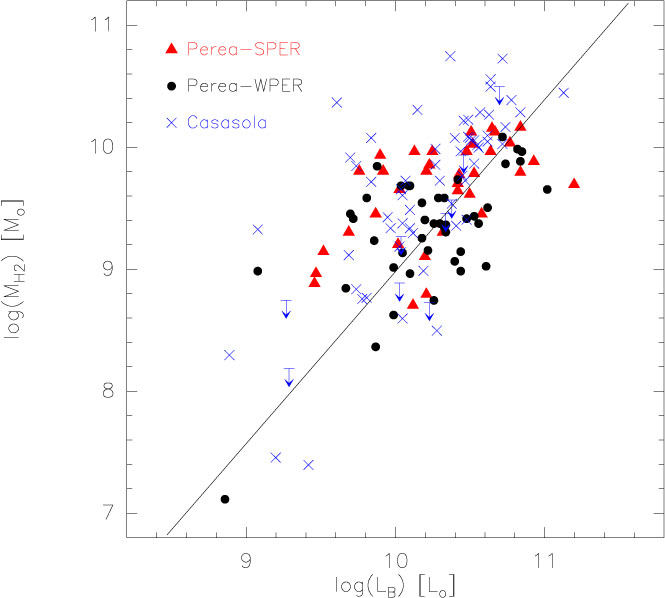
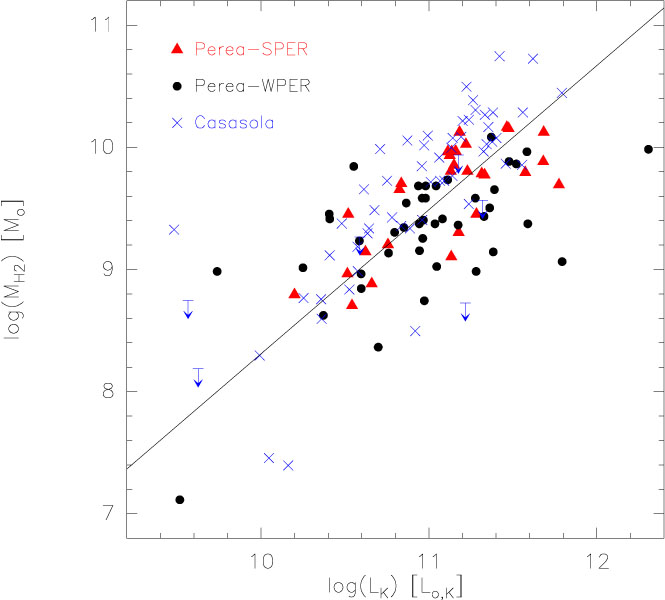
Fig. 2 The molecular gas mass vs. the blue luminosity (left), and the k-band luminosity (right), for different samples of interacting galaxies: Galaxies of type T = 3 − 5 from the sample of Casasola et al. (2004) and a sample of weakly (WPER) and strongly (SPER) perturbed galaxies from Perea et al. (1997). We adapted both their molecular gas masses and LB to our definition. The full line is the regression fit obtained for the AMIGA T = 3 − 5 sample from Table 7.
We also derived the molecular-to-atomic mass ratio as a function of morphological type and compared the result to the literature (see below). In agreement with results from other authors, we find a decreasing mass ratio for latter types. We find a mass ratio below 1 for all Hubble types, including early spiral galaxies.
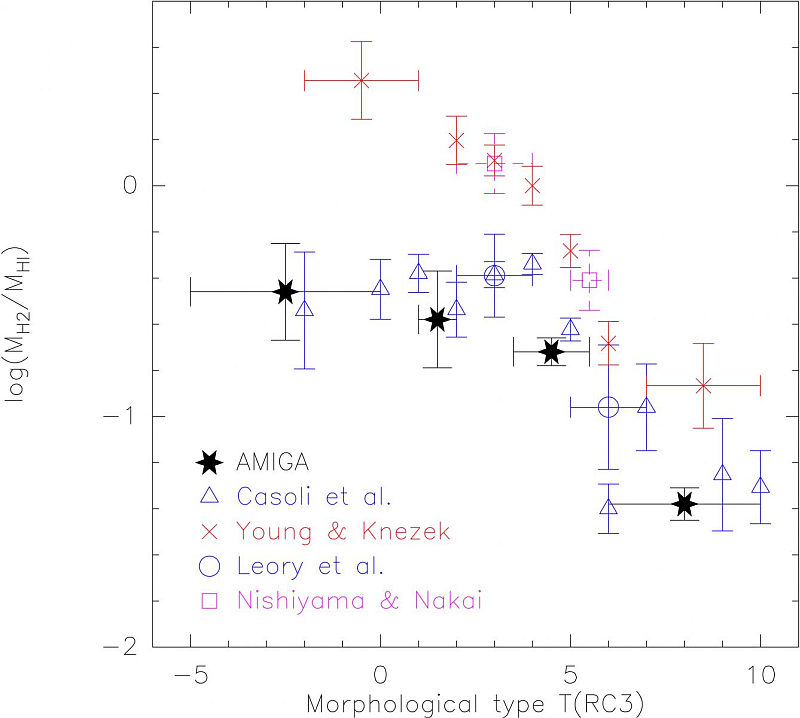
Fig. 3 Comparison of our values for the ratio between molecular gas mass and atomic gas mass (black stars) to those from the literature: Casoli et al. (1998, A&A, 331, 451) (blue triangles), Young & Knezek (1989, ApJ, 569, 157) (red crosses), Leroy et al. (2008, AJ, 136, 2782) (blue circles) and Nishiyama & Nakai (200, PASJ, 53, 7131) (magenta squares). The molecular gas mass have all been adapted to common conversion factor of 2 10**20cm**−2 and no consideration of the helium mass.
