Are (pseudo) bulges in isolated galaxies actually primordial relics?

Scientific Results

Are (pseudo) bulges in isolated galaxies actually primordial relics?

According to the properties observed in the central parts of galaxies, we can distinguist two main stellar systems: classical bulges are composed by old stellar populations, are dinamically suported by velocity dispersion and follow the same relations than early-type galaxies. On the other hand, disk-like bulges or pseudobulges are characterized by young stellar populations, are dinamically supported by rotation motions and present disky structures, such as spiral arms. They can contain substructures such as nuclear bars and rings. The surface brightness profile of pseudobulges is better represented by a sersic function with sersic index lower than 2 while the profile of classical bulges is more close to a De Vaucouleurs function.


Different formation mechanisms have been proposed for classical and pseudobulges. A rapid and violent process is expected to form the classical bulges because their similarity with early-type galaxies. In the case of pseudobulges, a more slowly formation is expected because they preserve some memory of their disky origin. However the role of the environment in the formation of both kind of bulges is not clear.


Understanding the main properties of central parts in isolated galaxies is important in the sense that their evolution is mainly driven by internal processes. We have performed a bulge/disk/bar decomposition using galfit with the aim to identify classical bulges and pseudobulges. Using the structural parameters obtained in the i-band, we made the decomposition in the g and r band for calculating the bulge and disk colors.

Fig 1Structural parameters in the i band for the bulges in the AMIGA–SDSS sample. Left panel: bulge Sérsic index vs. bulge-to-total ratio. Right panel: the Kormendy relation for classical bulges (red squares), low-B/T pseudobulges (green diamonds), and high-B/T pseudobulges (black triangles) taken from the left panel. For comparison, the Kormendy relation for the AMIGA early-type galaxies is given (blue points). An ordinary least-squares Y vs. X (points line), X vs. Y (dashed line), and bisector fit (solid line) to these galaxies are shown. 

In the left pannel of Fig. 1 we represented the bulge Sersic index versus the bulge to total luminosity ratio. We used a cut in sersic index of 2.5 to separate classical and paseudobulges. We found that 94% of bulges in the AMIGA sample are classified as pseudobulges. High-BT and low-BT pseudobulges are represented with different colors to check in the following analysis if high-BT can represent more evolved pseudobulges. In the right pannel we represented  the mean surface brightness within the effective radius for each kind of bulge in our sample. Classical bulges follow the Kormendy relation of early-type galaxies. In the case of pseudobulges, they tend to be located below the relation with high-BT pseudobulges forming an upper envelope, in the region consistent with the Kormendy relation.This seems to indicate some similarity with classical bulges.


We used (g-i) colors as indicative of the stellar population for bulge and disks in our sample. For disks, we use the magnitudes derived from the galfit fit in g and i-bands. In the case of the bulges, we use aperture photometry derived with ellipse. Galaxies were fitted in the i-band and then we calculated the aperture magnitudes in r and g-bands, fixing the ellipticity and position angle of each isophotal aperture equal to the i-band values.

Fig. 2. . (g−i) color for bulges and disks (blue spirals) vs. the absolute magnitude in the i band of the host galaxy (Mii). Different bulge types are represented with different symbols following Figure 1. The gray scale represents the density diagram obtained from the Nair & Abraham (2010) sample at 0.01 < z <0.05. The solid and dashed lines are the linear fit and its 2σ for the early-type galaxies. In the first panel, we represent the contours of equal density for these galaxies (solid line) and for Sbc–Sd spirals (dot-dashed line).

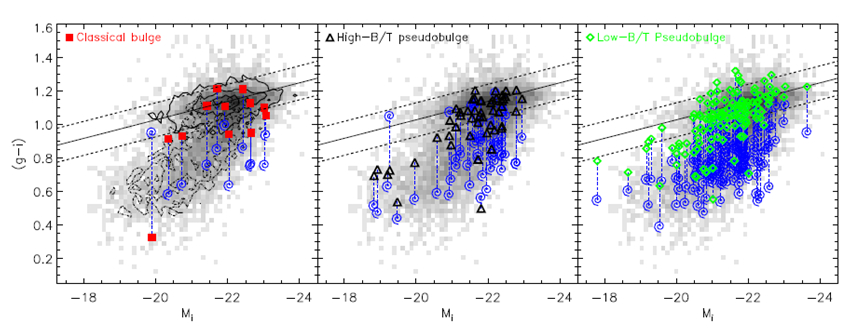
In Fig. 2 we represent the (g-i) color obtained for bulges and disks versus the total i-magnitude of our galaxies. The grey scale represent the color-magnitude relation obtained for the galaxies in the Nair & Abraham sample. The solid and dashed line are the linear fit and its 2 sigma to the red sequence of early-type galaxies. A 63% of our bulges are located in the red sequence. Regarding different bulges type, we found a 58% of high-BT pseudobulges and a 66% of low-BT pseudobulges in the red sequence, while their disks are much more bluer.There is not difference in colors of high and low-BT pseudobulges although disks of high-BT pseudobulges are redder than low-BT pseudobulges, probably because high-BT pseudobulges are located in earlier spiral types.

Colors of pseudobulges obtained here are consistent with old stellar populations. Pseudobulges are thought to form by secular evolution. We simulated the color of a bulge which form half of its mass in an instantaneous burst 8 Gyr ago and half through continous star formation during 8Gyr. The burst after 8Gyr has a very blue color. When both models are combined we can see that the color is still very blue, indicating than the continous star formation dominates the final color. Then, our results contrast with pseudobulges formation through a continous star formation. Secular evolution should stop long time ago if it is the formation mechanism.

The red bulge colors and low B/T values for AMIGA isolated galaxies are consistent with an early formation epoch and not much subsequent growth. Properties of bulges in isolated galaxies contrast with a picture where pseudobulges grow continuously via star formation. They also suggest that environment could be playing a role in rejuvenating the pseudobulges.

PDF File Fernández-Lorenzo et al. 2014