Scientific Results

Atomic gas scaling relations

The use of scaling relations is ubiquitous in extragalactic astronomy as many galaxy properties correlate with each other. These relations can be used to illuminate shifting trends in galaxy properties as a function of, for example, environment or redshift, or to approximate the most probable value of missing data. Atomic gas (HI) is one of the key constituents of the interstellar medium and the HI scaling relations of the AMIGA sample can act as a baseline of the HI content of a galaxy in the absence of interactions.

AMIGA scaling relations

We compiled from the literature and our own observations HI single dish spectra of over 800 CIG galaxies. After after making cuts for the quality of the spectra and AMIGA’s isolation criteria there are 544 spectra of well isolated galaxies (399 detections and 145 marginals and non-detections). As AMIGA represents a sample of galaxies with minimal impact from environment this sample can be used to define a baseline of HI-normalcy in the absence of interactions, which has not been updated for the most isolated galaxies since Haynes & Giovanelli 1984 (HG84).


We fit two scaling relations between HI mass and optical diameter and optical luminosity using a maximum likelihood regression model that includes the contribution of upper limits (marginals and non-detections) and measurement uncertainties in both dependent and independent variables (including distance uncertainties). We find that our HI mass to optical diameter relation is almost identical to that of HG84, but our relation with optical luminosity is considerably steeper. The lack of accounting for measurement uncertainty (in the independent variable) in the OLS regression method used by HG84 and others explains some, but not all, of this difference.


The remaining difference is attributed to the slightly earlier morphology distribution of our sample compared to HG84 as later types are found to have flatter gradient relations and higher intercept values, i.e. late-type, low-luminosity galaxies are more HI-rich than their earlier type equivalents, and later type galaxies are generally more HI-rich. We also noted that when split by morphological type the luminosity-based relations had lower estimates of intrinsic scatter than the diameter-based ones. Although diameter has typically been found to be the best predictor of HI mass, this might indicate that once morphology is completely accounted for, luminosity could be an intrinsically better predictor.

Scatter plots of the HI mass of AMIGA galaxies as a function of their optical diameters (top) and B-band luminosities (bottom). The black points indicate detected sources and the grey arrows indicate upper limits (in HI mass). The typical measurement uncertainty is shown by the black ellipses. The heavy blue line shows the scaling relations fit in this work using our maximum likelihood method, the dotted red line shows the result using ordinary least squares regression, and the green, pink, and orange dashed lines show the results or related samples of Haynes & Giovanelli 1984, Solanes et al. 1996, and Denes et al. 2014.

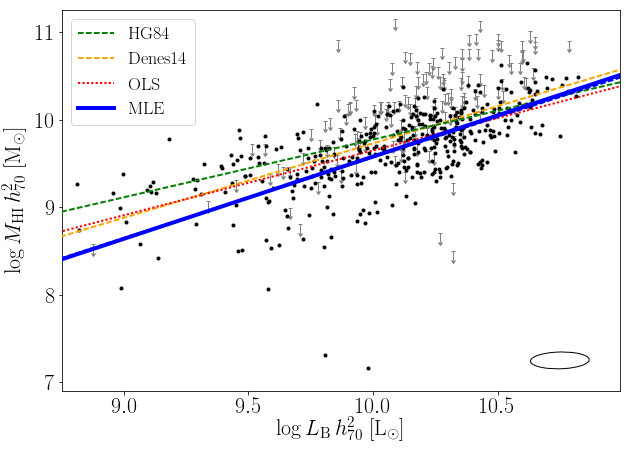
The resulting relations were used to define an up-to-date measure of HI-deficiency, which we applied to a sample of Virgo cluster galaxies. We found consistent results with previous studies of the cluster, that most galaxies in Virgo are only HI-deficient by a factor of a few, but some galaxies have lost over 90% of their HI. An important improvement of our relations is that the diameter and luminosity relations give almost entirely consistent measures of HI-deficiency (within the uncertainties), whereas the HG84 relations estimated substantially higher HI-deficiencies from the optical luminosity than the diameter.

In conclusion, these relations define an up-to-date baseline of HI-normalcy for a galaxy without interactions. For an individual galaxy this allows its nominal HI mass to be predicted with an accuracy of 0.25 dex. Thus, these relations are ideal for statistical studies of galaxies the have lost, or are currently losing, their neutral gas, such as those in compact groups.

  Jones et al. 2018