 Instituto de Astrofísica de Andalucía
Star formation suppression in compact group galaxies: a new path to quenching?
Scientific Results
- Positions for CIG galaxies
- Redshift and distances
- Morphologies
- Isolation
- A catalogue of neighbours around isolated galaxies based on POSS I & II images
- Quantification of isolation based on POSS I & II images
- Revision of isolation criteria using the SDSS
- Effects of the environment on galaxies in the..
- Catalogues of isolated galaxies, isolated pairs, and isolated triplets..
- Star formation
- Optical specialization
- Radio continuum properties
- Atomic gas
- Isolated Galaxies
- Environment and faint features of CIG 96: deep optical and HI observations (2018)
- Atomic gas scaling relations (2018)
- A ∼12 kpc HI extension and other HI asymmetries in the isolated galaxy CIG 340 (2014)
- HI asymmetry in the isolated galaxy CIG 85 (2012)
- HI asymmetries in the isolated galaxy CIG 292 (2011)
- Asymmetries in isolated galaxies (2011)
- The large asymmetric HI envelope of CIG 96 (2005)
- Compact groups
- Studies of complementary samples
- Isolated Galaxies
- Molecular gas
- Nuclear activity
Star formation suppression in compact group galaxies: a new path to quenching?
In the current work CO(1–0) maps of 12 warm H2-selected Hickson Compact Groups (HCGs) are presented, covering 14 individually imaged warm H2 bright galaxies, with the Combined Array for Research in Millimeter Astronomy (CARMA).
A variety of molecular gas distributions within the HCGs was found, including regularly rotating disks, bars, rings, tidal tails, and possibly nuclear outflows, though the molecular gas morphologies are more consistent with spirals and early-type galaxies than mergers and interacting systems.
These CO-imaged HCG galaxies, when plotted on the Kennicutt–Schmidt relation, show star formation (SF) suppression of 10 +/- 5 distributed bimodally, with five objects exhibiting suppressions of around 10 and depletion timescales around 10 Gyr. This SF inefficiency is also seen in the efficiency per freefall time of Krumholz et al.
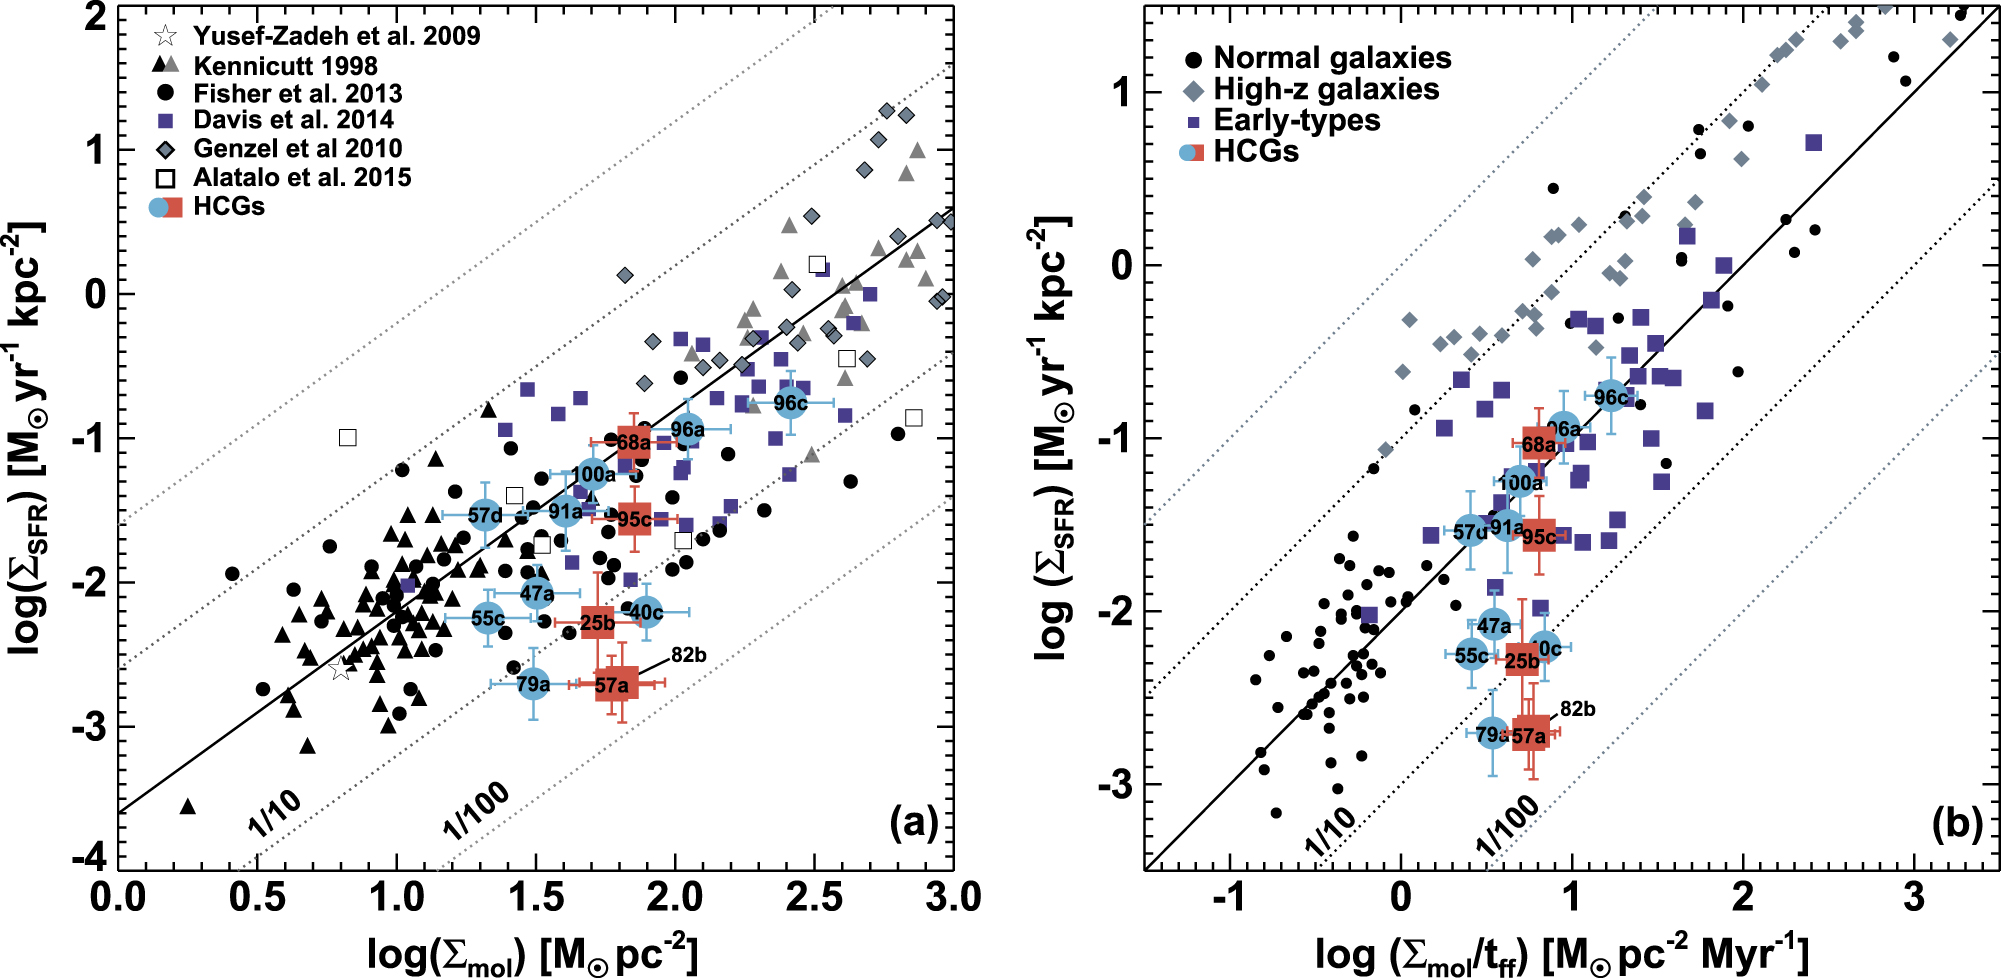
(Left) SFR and gas surface density in this HCG sample are shown in comparison on the Kennicutt–Schmidt relation (Kennicutt 1998). The SFRs were taken from Bitsakis et al. (2014), normalized to a Salpeter Initial Mass Function (IMF; Salpeter 1955). The HCGs are compared to the Milky Way (Yusef-Zadeh et al. 2009), normal galaxies or LIRGs (Kennicutt 1998; Fisher et al. 2013), CO-imaged early-type galaxies (Davis et al. 2014), high redshift objects (Genzel et al. 2010), and radio galaxies (Ogle et al. 2010; Alatalo et al. 2015b), all renormalized to a Salpeter IMF. The solid black line represents the Kennicutt–Schmidt relation, and dashed lines represent levels of 1/10 and 1/100 suppression (below) and enhancement (above). The shapes and colors of the HCG points are based on whether they meet the MOHEG criterion from Ogle et al. (2007), with red squares for HCGs with LH2,warm/L7.7um,PAH> 0.04, considered confirmed MOHEGs, and blue circles representing those below this threshold. The SFR error bars include the 10% errors quoted in Bitsakis et al. (2014), and the 0.38 dex scatter in magphys-derived SFRs from Lanz et al. (2013), added in quadrature. (Right) The SF laws from Krumholz et al. (2012) are plotted for nearby and high-z galaxies (black dots and gray diamonds, respectively; Krumholz et al. 2012and references therein), and early-type galaxies (indigo squares; Davis et al. 2014), all normalized to a Salpeter IMF (Salpeter 1955). The axes of panel (b) were chosen to match the axes shown in Krumholz et al. (2012). Dotted lines represent suppressions and enhancements of 10 and 100. The HCGs found to be suppressed in panel (a) are also suppressed in panel (b).
The gas-to-dust ratios of these galaxies are investigated to determine if an incorrect LCO–M(H2) conversion caused the apparent suppression and find that HCGs have normal gas-to-dust ratios. It is likely that the cause of the apparent suppression in these objects is associated with shocks injecting turbulence into the molecular gas, supported by the fact that the required turbulent injection luminosity is consistent with the bright H2 luminosity reported by Cluver et al. Galaxies with high SF suppression (around 10) also appear to be those in the most advanced stages of transition across both optical and infrared color space.
This supports the idea that at least some galaxies in HCGs are transitioning objects, where a disruption of the existing molecular gas in the system suppresses SF by inhibiting the molecular gas from collapsing and forming stars efficiently. These observations, combined with recent work on poststarburst galaxies with molecular reservoirs, indicates that galaxies do not need to expel their molecular reservoirs prior to quenching SF and transitioning from blue spirals to red early-type galaxies. This may imply that SF quenching can occur without the need to starve a galaxy of cold gas first.
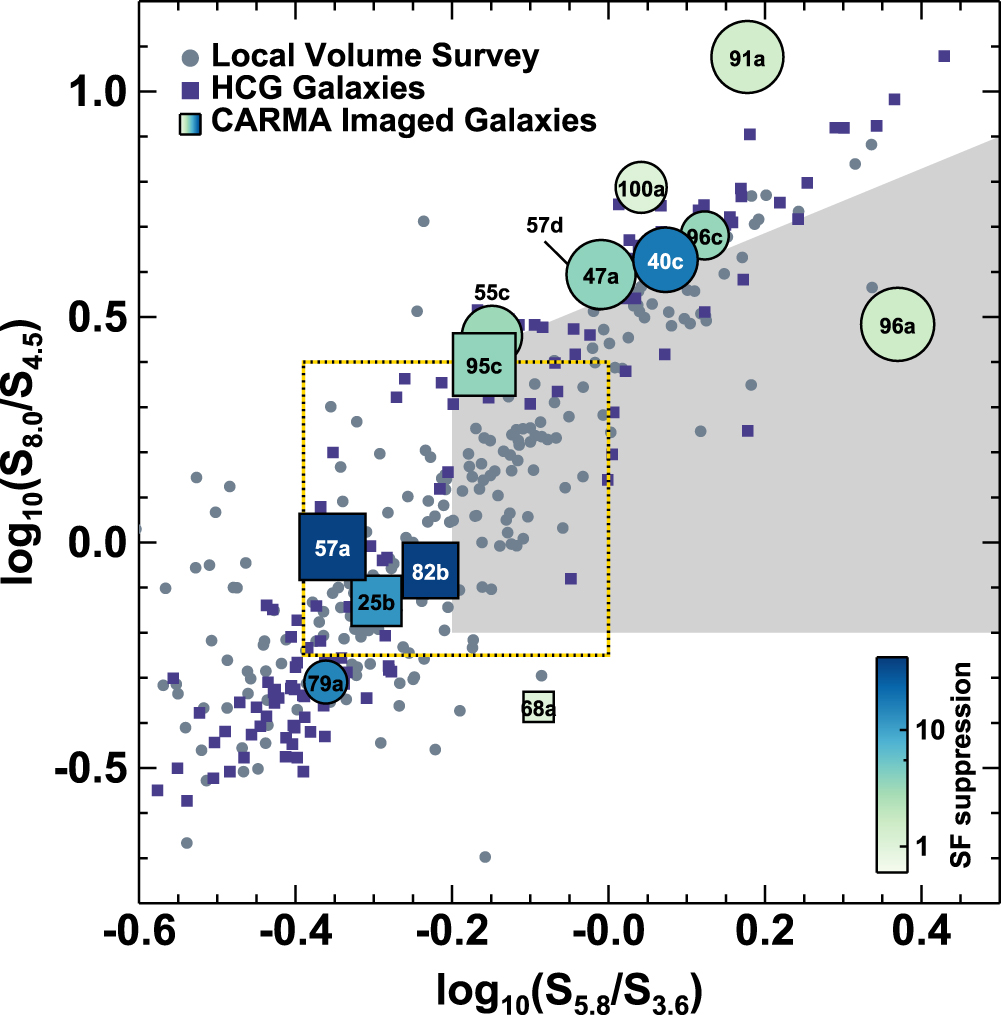
S5.8um/S3.6um vs. S8.0um/S4.5um Spitzer IRAC colors of a sample of HCGs (blue squares; Bitsakis et al. 2011; Cluver et al. 2013) compared to the Spitzer local volume legacy sample (gray dots; Dale et al. 2009), with the so-called Lacy wedge (circumscribing the AGN region in the plot) shown in light gray (Lacy et al. 2004, 2007, 2013). This plot shows the gap seen for HCGs described by Johnson et al. (2007) and Walker et al. (2010), highlighted as a yellow and black dashed line. The CO-imaged HCGs are overplotted with the color of the point representing the level of SF suppression, the size of the points representing the mass of the molecular reservoir in each HCG galaxy, and the shapes indicating whether the galaxy is a MOHEG from Cluver et al. (2013). Among the labeled HCG galaxies, squares represent MOHEGs (LH2,warm/L7.7um,PAH > 0.04) and circles non-MOHEGs. HCGs with the strongest suppression tend to be those that occupy the infrared gap in Spitzer color space.
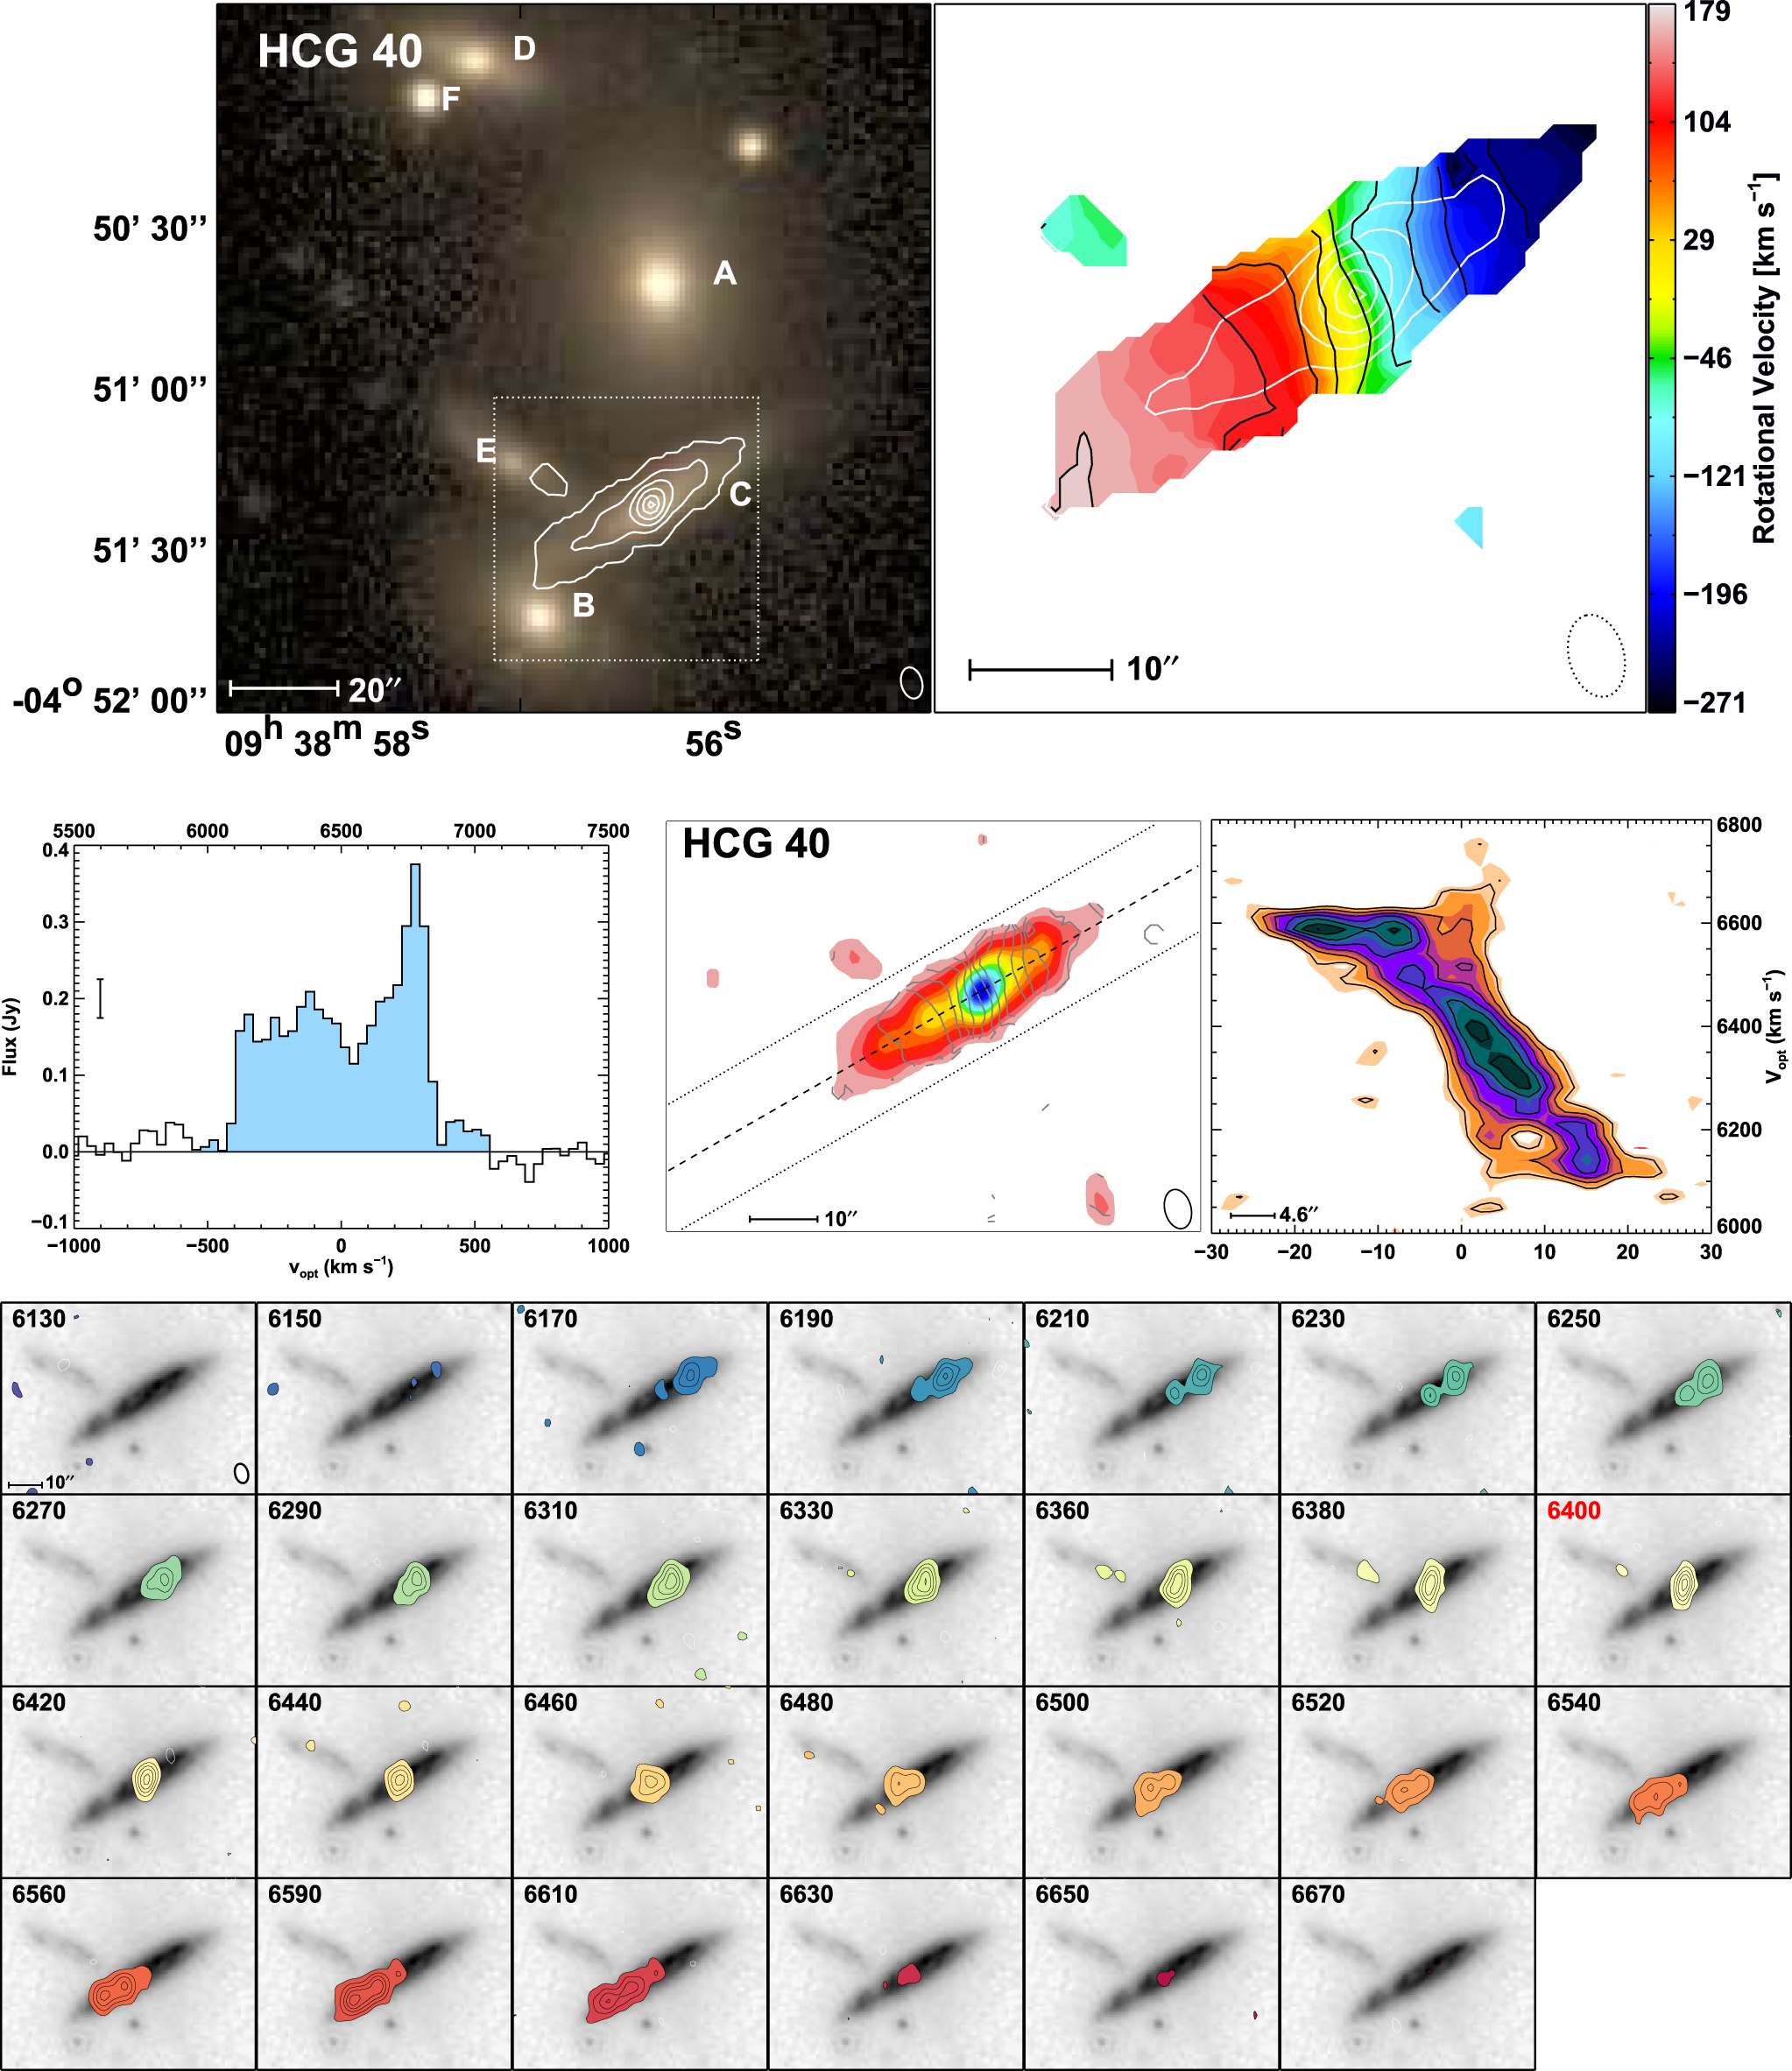
HCG 40. Channel map contours are in 3σ steps. HCG 40c is an edge-on galaxy strongly detected with CARMA. While HCG 40c lies in the red part of the WISE IRTZ, it is found in the optical green valley, though near the red sequence. It also has a radio core and optically identified AGN (Martínez et al. 2010). Two Micron All-sky Survey (2MASS) imaging also shows that HCG 40c is tidally interacting with HCG 40e (Skrutskie et al. 2006). The PVD of HCG 40c also shows a significant bar (seen as the large velocity structure with very little position shift), similar to what was seen by Alatalo et al. (2013) in several ATLAS3D early-type galaxies. This is likely what is responsible for the slight appearance of broad wings in the CO spectrum. Given the frequency with which bars arise during gravitational encounters (Athanassoula 1996; Athanassoula & Bureau 1999), it is unsurprising that HCG 40c is morphologically classed as a bar+ring.
References:
Alatalo K., Davis T. A., Bureau M. et al 2013 MNRAS 432 1796
Alatalo K., Lacy M., Lanz L. et al 2015b ApJ 798 31
Athanassoula E. 1996 ASP Conf. Ser., IAU Coll. 157, Barred Galaxies, Vol. 91 ed R. Buta, D. A. Crocker and B. G. Elmegreen (San Francisco, CA: ASP) 309
Athanassoula E. and Bureau M. 1999 ApJ 522 699
Bitsakis T., Charmandaris V., da Cunha E. et al 2011 A&A 533 A142
Bitsakis T., Charmandaris V., Appleton P. N. et al 2014 A&A 565 A25
Cluver M. E., Appleton P. N., Ogle P. et al 2013 ApJ 765 93
Dale D. A., Cohen S. A., Johnson L. C. et al 2009 ApJ 703 517
Davis T. A., Young L. M., Crocker A. F. et al 2014 MNRAS 444 3427
Fisher D. B., Bolatto A., Drory N. et al 2013 ApJ 764 174
Genzel R., Tacconi L. J., Gracia-Carpio J. et al 2010 MNRAS 407 2091
Johnson K. E., Hibbard J. E., Gallagher S. C. et al 2007 AJ 134 1522
Kennicutt R. C. Jr. 1998 ApJ 498 541
Krumholz M. R., Dekel A. and McKee C. F. 2012 ApJ 745 69
Lacy M., Storrie-Lombardi L. J., Sajina A. et al 2004 ApJS 154 166
Lacy M., Petric A. O., Sajina A. et al 2007 AJ 133 186
Lacy M., Ridgway S. E., Gates E. L. et al 2013 ApJS 208 24
Lanz L., Zezas A., Brassington N. et al 2013 ApJ 768 90
Martínez M. A., Del Olmo A., Coziol R. and Perea J. 2010 AJ 139 1199
Ogle P., Antonucci R., Appleton P. N. and Whysong D. 2007 ApJ 668 699
Ogle P., Boulanger F., Guillard P. et al 2010 ApJ 724 1193
Salpeter E. E. 1955 ApJ 121 161
Skrutskie M. F., Cutri R. M., Stiening R. et al 2006 AJ 131 1163
Walker L. M., Johnson K. E., Gallagher S. C. et al 2010 AJ 140 1254
Yusef-Zadeh F., Hewitt J. W., Arendt R. G. et al 2009 ApJ 702 178
