Evolution in compact groups: The HI content of Hickson Compact Group 16 (2019)
Scientific Results
- Positions for CIG galaxies
- Redshift and distances
- Morphologies
- Isolation
- A catalogue of neighbours around isolated galaxies based on POSS I & II images
- Quantification of isolation based on POSS I & II images
- Revision of isolation criteria using the SDSS
- Effects of the environment on galaxies in the..
- Catalogues of isolated galaxies, isolated pairs, and isolated triplets..
- Star formation
- Optical specialization
- Radio continuum properties
- Atomic gas
- Isolated Galaxies
- Environment and faint features of CIG 96: deep optical and HI observations (2018)
- Atomic gas scaling relations (2018)
- A ∼12 kpc HI extension and other HI asymmetries in the isolated galaxy CIG 340 (2014)
- HI asymmetry in the isolated galaxy CIG 85 (2012)
- HI asymmetries in the isolated galaxy CIG 292 (2011)
- Asymmetries in isolated galaxies (2011)
- The large asymmetric HI envelope of CIG 96 (2005)
- Compact groups
- Studies of complementary samples
- Isolated Galaxies
- Molecular gas
- Nuclear activity
Evolution in compact groups: The HI content of Hickson Compact Group 16
HCG 16 is a prototypical case of and intermediate stage group in the evolutionary model of Verdes-Montegro et al. 2001. Its galaxies are in the process of losing their gas into the intra-group medium and there are numerous on-going processes, such as active nuclei, starburst events, a new group member, and enormous tidal features. This makes HCG 16 an ideal case study to assess which processes are likely those responsible for driving the evolution of compact groups from this stage to their final state where the galaxies are devoid of HI gas.
In this work we re-reduced archival VLA observations of the group, processing and analysing the data with the the latest tools and algorithms. This included the using the multi-scale CLEAN algorithm to image the data and the SlicerAstro package to separate galaxies from tidal features. We also constructed a 3D representation of the final HI data cube using the X3D framework.
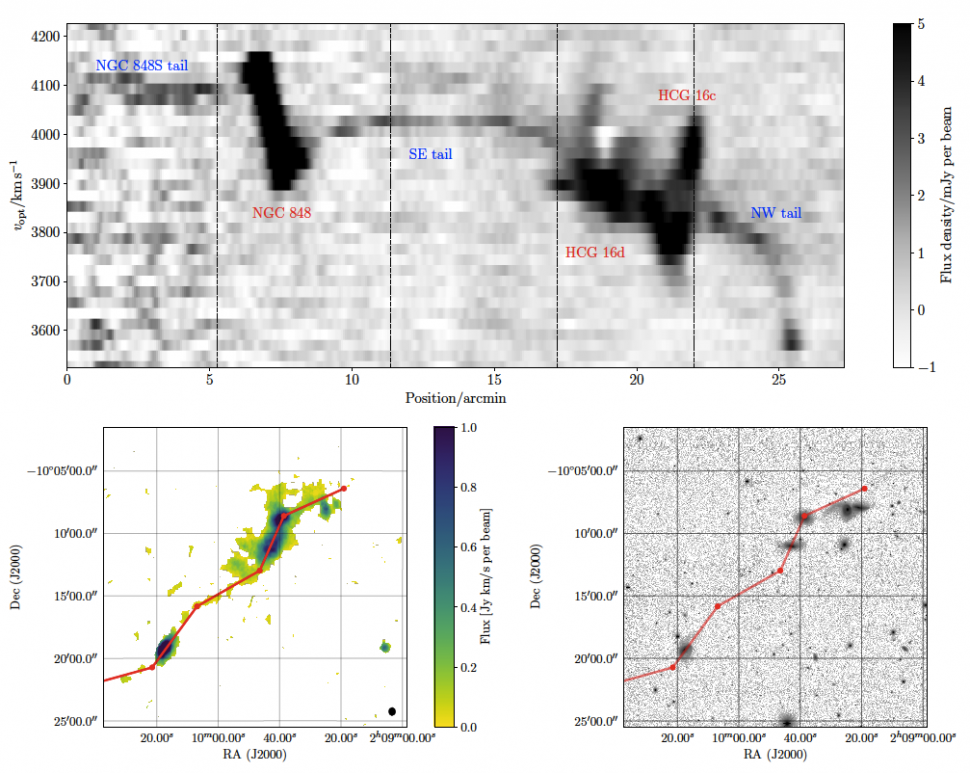
As can be seen in the figure of this link, the HI content of the groups is highly disturbed, however, globally the group is not deficient in HI when compared to isolated AMIGA galaxies. The majority of the gas spread throughout the group appears to have originated from the pair HCG 16a and b, which are both highly HI-deficient. The 160 kpc long HI tail that extends to the South-East and connects NGC 848 to the core group, appears to be part of an even larger continuous structure (see below) which was probably formed when NGC 848 passed close by the core group and attracted loosely bound gas in the vicinity of HCG 16a and b.
Caption: Top: A segmented position–velocity diagram showing the spatially and kinematically continuous HI emission spanning HCG 16. The vertical dashed lines show the locations of the nodes making up the segmented slice through the data cube. Galaxies are labelled in red and tidal features in blue. Note that the noise in this plot increases significantly near the left edge as this region is approaching the primary beam edge.
Bottom: The left panel shows the position–velocity slice as a segmented red line on top of the moment 0 map and the right panel shows the same line but overlaid on a DECaLS r-band image.
Galaxies HCG 16c and d also appear to be interacting, but unlike HCG 16a and b they both have greatly elevated star formation rates (SFRs). Both galaxies are known to have galactic winds driven by these starbursts and have morphologies reminiscent of M82. While the HI kinematics of HCG 16c are mostly regular the HI reservoir of HCG 16d appears to have been almost completely disrupted by this wind. At their present SFRs these two galaxies will exhaust their gas supply (atomic + molecular) within about 1 Gyr, also leaving them extremely HI-deficient, but predominantly due to star formation rather than tidal stripping, in contrast to HCG 16a and b. The remaining atomic gas in the intra-group medium is expected to be quite long lived (>1 Gyr) as although there is hot gas in this multi-phase medium is does not appear to be sufficiently energetic to destroy the HI. Thus it is expected to be gradually photo-evaporated by the UV background over several Gyrs, resulting in a collection of HI-deficient galaxies with tenuous HI features between them.
Reproducibility:
A large component of this project was to demonstrate that reproducibility is an achievable goal, not just an ideal, even for modern, real astronomy papers. During this project we constructed a complete workflow beginning with the raw data, as provided by the observatory, all the way to the final data products and figures in the paper. This workflow is designed around Docker containers and Conda environments so that it can be executed on almost any machine without the need to install each dependency. For further details please visit the associated github page: github.com/AMIGA-IAA/hcg-16
In addition to the workflow, for those interested in just reproducing or modifying our final figures, there are all the Jupyter notebooks which were used to make the paper figures. These can be run entirely in the cloud using the mybinder service: mybinder.org/v2/gh/AMIGA-IAA/hcg-16/master

