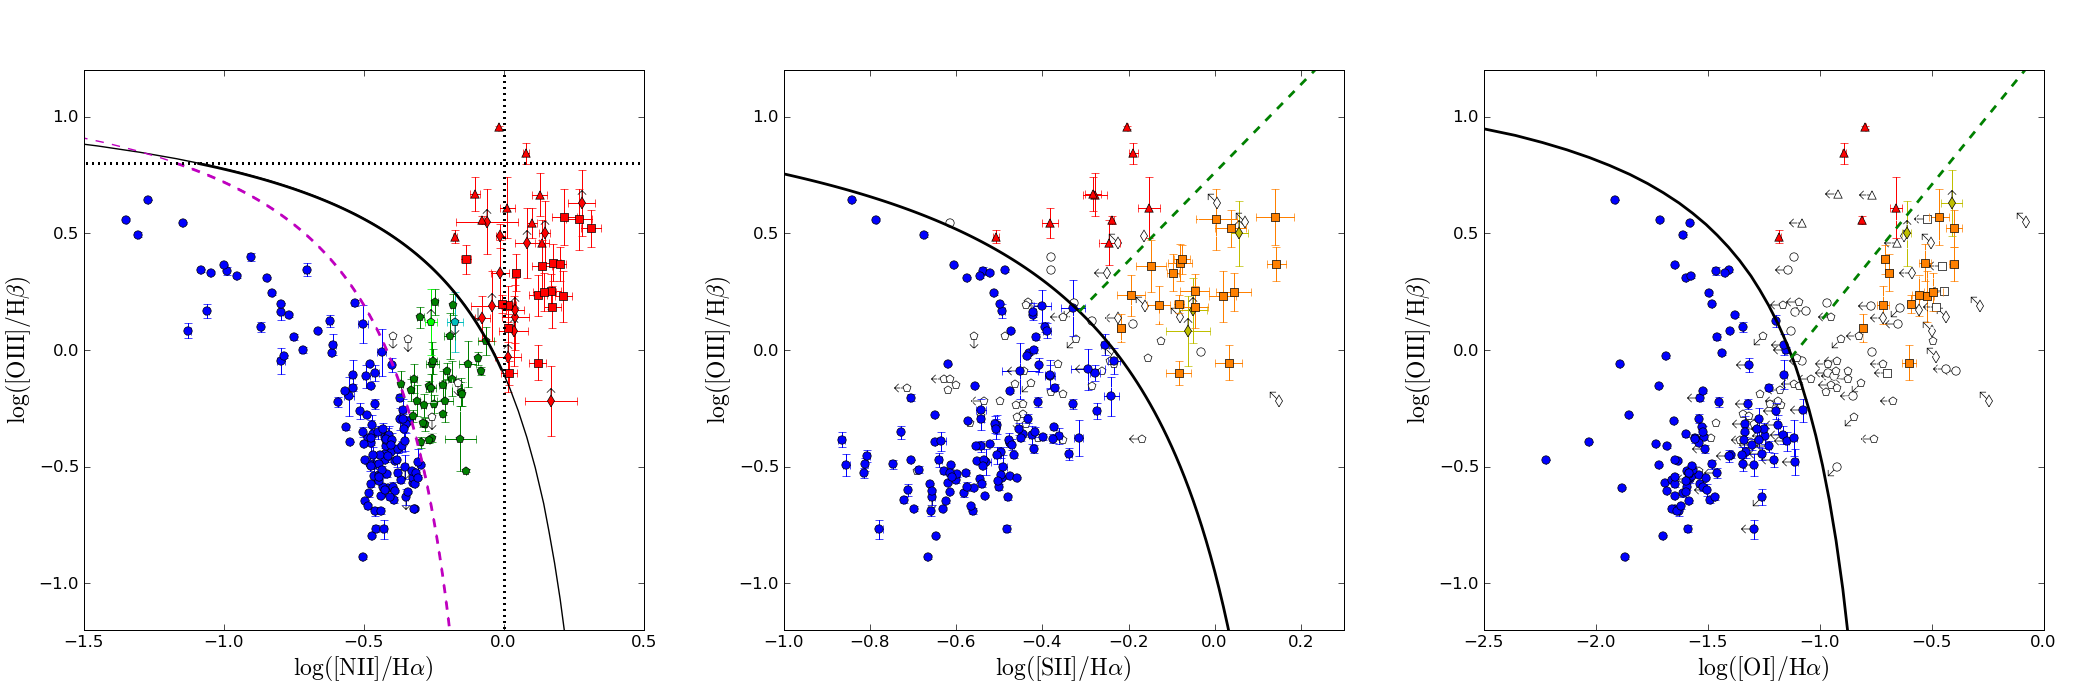
The figure above shows the emission line diagnostic diagrams. Error bars have been plotted, and an arrow added for upper or lower limits. Left panel: [N ii] diagnostic diagram. The shape of the marker indicates the final classification of nuclear activity: circle – SFN; pentagon – TO; triangle – Sy2; square – LINER, diamond – NLAGN. Filled markers correspond to galaxies classified using this diagnostic diagram, and the colour indicates the derived classification: red – AGN; green – TO; blue – SFN; cyan – TO or SFN; light green – TO or AGN. See Section 3 for a complete description of the classification scheme. Middle panel: [S II] diagnostic diagram. The AGN-SFN separation curve of
Kewley et al. (2001) is shown as a black solid line and the Sy2-LINER separation line of
Kewley et al. (2006) as a green dashed line. Symbol shapes are the same as in the [N II] diagram and the colours indicate the classification obtained with this diagram: red – Sy2; yellow – NLAGN; orange – LINER; and blue – SFN. Right panel: [O I] diagnostic diagram. Symbol shapes are the same as in the [N ii] diagram. Colours and separation curves are the same as in the [S II] diagram. Empty symbols correspond to galaxies that cannot be unambiguously classified using this diagram but that were eventually classified using the other diagrams.
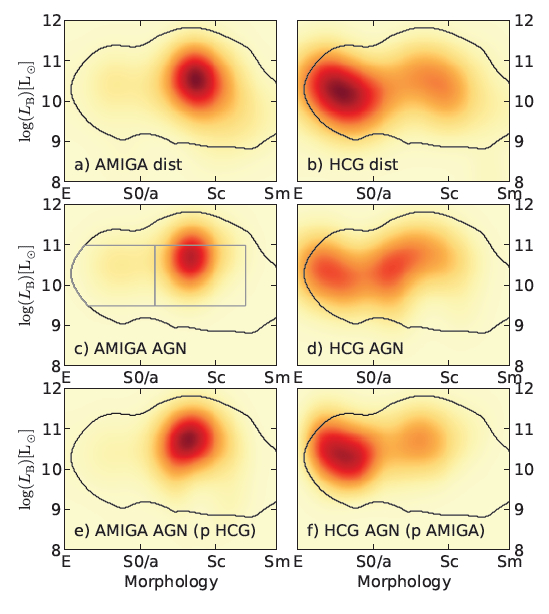
We provide a final catalogue of spectroscopic data, stellar populations, emission lines and classification of optical nuclear activity for AMIGA galaxies. The prevalence of optical active galactic nuclei (AGN) in AMIGA galaxies is 20.4%, or 36.7% including transition objects. The fraction of AGN increases steeply towards earlier morphological
types and higher luminosities.
We compare these results with a matched analysis of galaxies in isolated denser environments (Hickson Compact Groups). After correcting for the effects of the morphology and luminosity, we find that there is no evidence for a difference in the prevalence of AGN between isolated and compact group galaxies, and we discuss the implications of this result.
 Instituto de Astrofísica de Andalucía