A ∼12 kpc HI extension and other HI asymmetries in the isolated galaxy CIG 340 (2014)
Scientific Results
- Positions for CIG galaxies
- Redshift and distances
- Morphologies
- Isolation
- A catalogue of neighbours around isolated galaxies based on POSS I & II images
- Quantification of isolation based on POSS I & II images
- Revision of isolation criteria using the SDSS
- Effects of the environment on galaxies in the..
- Catalogues of isolated galaxies, isolated pairs, and isolated triplets..
- Star formation
- Optical specialization
- Radio continuum properties
- Atomic gas
- Isolated Galaxies
- Environment and faint features of CIG 96: deep optical and HI observations (2018)
- Atomic gas scaling relations (2018)
- A ∼12 kpc HI extension and other HI asymmetries in the isolated galaxy CIG 340 (2014)
- HI asymmetry in the isolated galaxy CIG 85 (2012)
- HI asymmetries in the isolated galaxy CIG 292 (2011)
- Asymmetries in isolated galaxies (2011)
- The large asymmetric HI envelope of CIG 96 (2005)
- Compact groups
- Studies of complementary samples
- Isolated Galaxies
- Molecular gas
- Nuclear activity
A ∼12 kpc HI extension and other HI asymmetries in CIG 340
As part on an ongoing programme to understand the origin of the asymmetries in HI profiles of isolated galaxies we used the GMRT to observe resolved HI in optically symmetric galaxy CIG 340 (IC2487). CIG 340 was chose because it has one on the most symmetric single dish HI profiles in the sample of AMIGA galaxies studied by  Espada et al. 2011
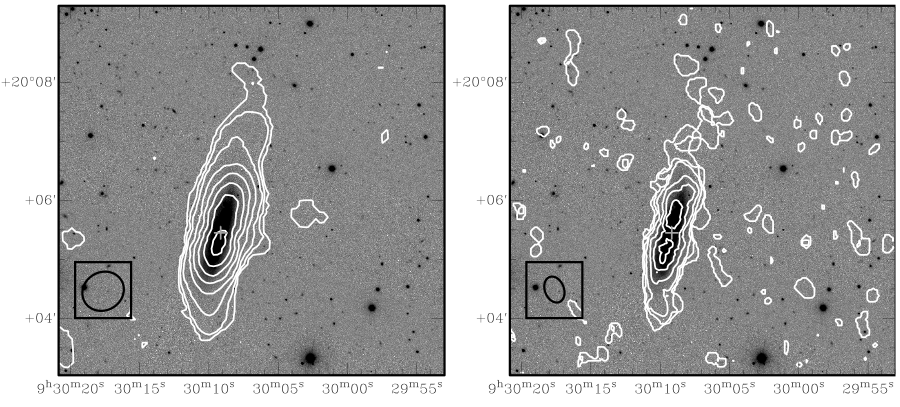
Fig. 1 Integrated HI emission contours (white) overplotted on a SDSS r-band images. Left: integrated emission contours from the low resolution HI map, (beam size = 45.57′′ × 41.35′′) where the HI column density levels are 1020 atoms cm−2 × (0.5, 1.2, 2.3, 4.7, 7.0, 9.3, 11.6, 14.0). Right: integrated emission contours from the high resolution HI map, (beam size = 26.08′′ × 19.97′′) where the HI column density levels are 1020 atoms cm−2 × (1.6, 3.2, 6.3, 10.6, 19.0, 25.3). The first contours are at the 3σ level. At the bottom left of each panel a black ellipse shows the beam size. The optical centre of the galaxy is marked with a grey cross.
Our GMRT HI mapping revealed significant HI morphological asymmetries despite CIG340 having a highly symmetric HI spectrum (A flux = 1.03 ± 0.02). The most notable HI features are the warped disk (with an optical counterpart), the ratio of HI emission north and south of the optical centre (1.32) and a ∼ 45′′ (12 kpc) HI extension at the northern edge of the disk. While the HI extension is morphologically distinguishable from main body of the HI disk suggesting a recent perturbation (∼108 yr), there is no unambiguous equivalent kinematic signature. Based on its distinct morphology the most likely source of the HI extension appears to be an interaction with a small currently undetected satellite. This satellite may also be responsible for producing the lopsidedness and the warped stellar / HI disks. CIG 340 demonstrates that in isolated galaxies a highly symmetric HI spectrum can still mask significant HI morphological asymmetries, which can be revealed by HI interferometric mapping. The results have been published in  Scott et al. 2014.
